25 Repositories
Android earthquake-visualization Libraries

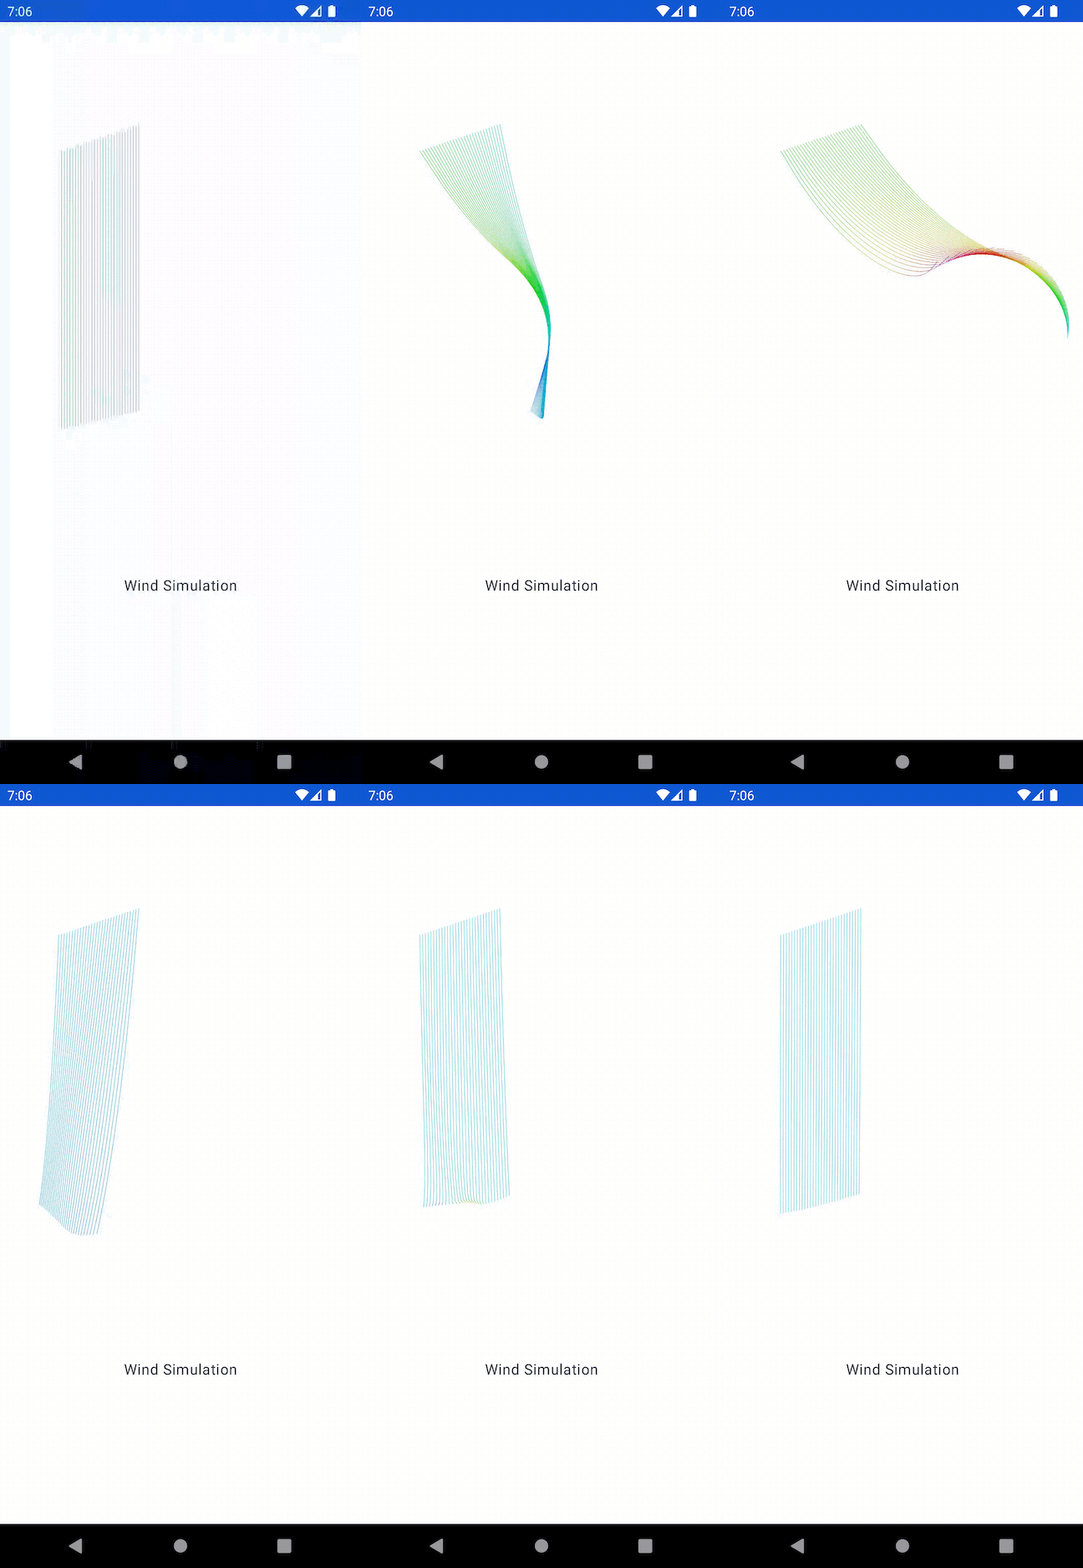
Data2Viz port/wrapper for data visualization with Jetpack Compose
Collage Data2Viz port/wrapper for Jetpack Compose. It is a visualization library, same as Data2Viz and d3. This is obviously not an official Data2Viz
CPU Scheduler Visualization written in Kotlin TornadoFX
CPU-Scheduler-Visualization CPU Scheduler Visualization written in Kotlin TornadoFX 목적 CPU Secheduling algorithm을 시각화해주는 프로그램입니다. FCFS, NonPreemptiveS

A mobile application that contains up-to-date information about the latest earthquakes in Turkey, scientific explanations about earthquakes, and Turkey's earthquake map.
Recent-Earthquakes A mobile application that contains up-to-date information about the latest earthquakes in Turkey, scientific explanations about ear

Earthquake - Earthquake app built with kotlin
Earthquake Earthquake app provides features below: Lists the recent 200 earthqua

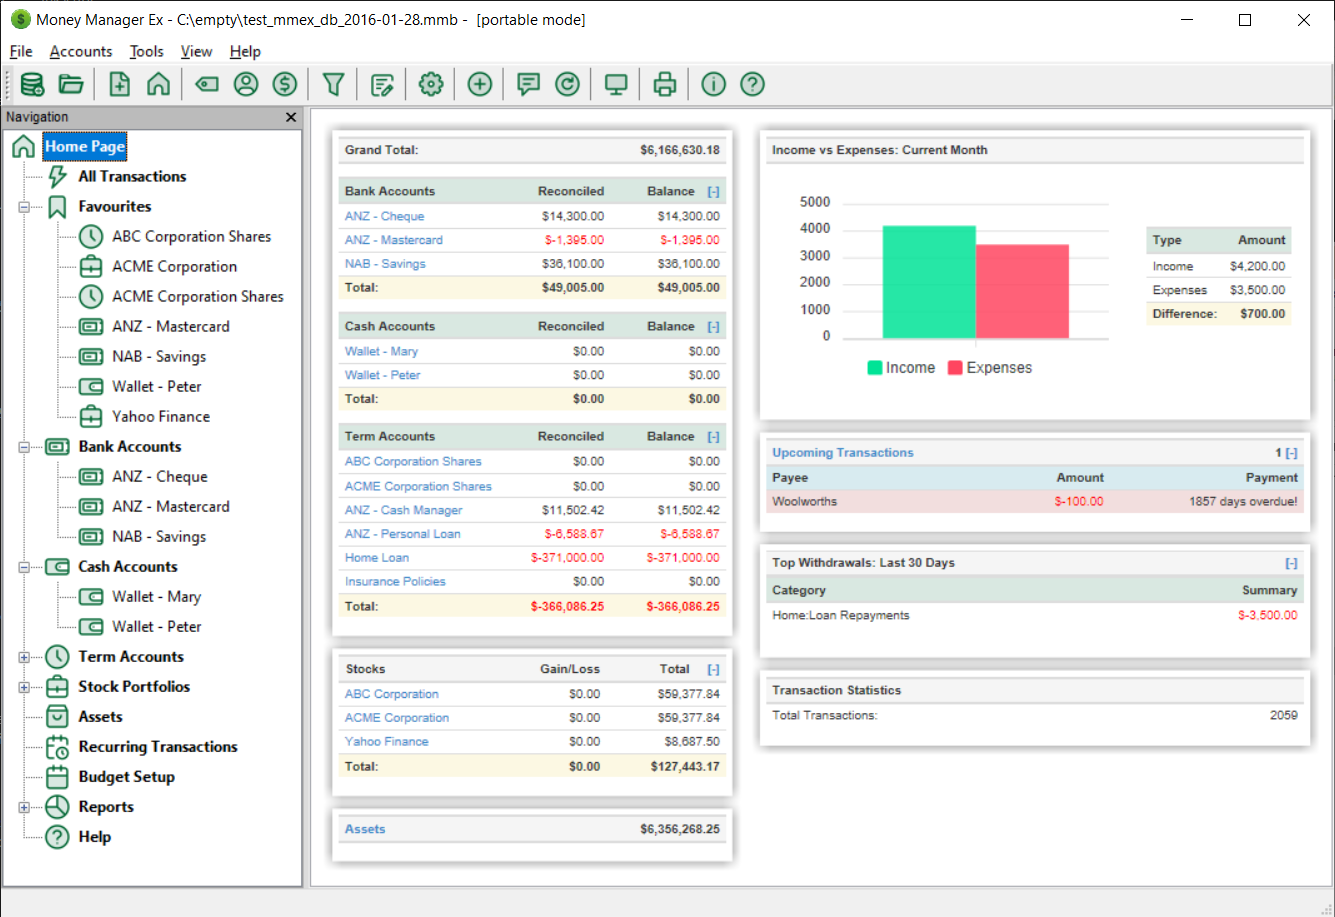
Money Manager Ex is a free, open-source, cross-platform, easy-to-use personal finance software
Money Manager Ex is a free, open-source, cross-platform, easy-to-use personal finance software. It primarily helps organize one's finances and keeps track of where, when and how the money goes.

A classic password visualization concept, ported to Android
A classic password visualization concept, ported to Android Chroma-Hash is a concept for visualizing secure text input using ambient color bar
An Android, JavaFx, JS multiplatform datavisualization library with comprehensive DSL
Isomorphic dataviz Data2viz is a data visualization toolbox for Kotlin Multiplatform. You can pick what you need in the different modules and use them

A {K}otlin g{ra}mmar for data {vis}ualization
kravis - A {k}otlin {gra}mmar for data {vis}ualization Visualizing tabular and relational data is the core of data-science. kravis implements a gramma

Android library for drawing Pie charts and Donut charts with the ability to customize almost anything in it.
A Pie/Donut*/Ring chart for Android, customizable to the most extent possible. For tutorial and examples refer to the website. build.gradle[.kts] impl
Monitors and records the CPU and memory usage of Android devices
AnotherMonitor . AnotherMonitor monitors and records the CPU and memory usage of Android devices. ANOTHERMONITOR IS IN LOW DEVELOPMENT STATUS But not

An educational android app that provides services like notes, online videos and visualization calculator to learn and understand deep concepts of DSA.
Aldo ALDO is a free education app for the young programmers who are desiring to master the concepts of Data Structure and Algorithms. ALDO offers prac
Earthquake Android application for Indonesia region with data from BMKG
Awas Gempa Bumi Aplikasi yang menampilkan data gempa terbaru di Indonesia dengan sumber dari BMKG. Fitur : Menampilkan data gempa terbaru sesuai denga
A JavaFX app to visualize RNA alignments from Rfam database.
Kaknas Kaknas is a JavaFX graphical tool to visualize and manipulate RNA alignments from the Rfam database. It is powered with RNArtistCore. For a giv
Detailing about the data provided (Data Visualization Application)
Detailing about the data provided (Data Visualization Application): • In the application, the data provided in the CSV is used for the Scatter plot cr
A model-agnostic visual debugging tool for machine learning
Manifold This project is stable and being incubated for long-term support. Manifold is a model-agnostic visual debugging tool for machine learning. Un
A visualization tool for various pathfinding algorithms.
Pathfinding Visualizer Welcome to Pathfinding Visualizer! I built this application because I was fascinated by pathfinding algorithms, and I wanted to
This android app fetches the data from the USGS API in real time to display a list of earthquakes.
This android app fetches the data from the USGS API in real time to display a list of earthquakes. On clicking an earthquake it opens a browser window with the complete information of the earthquake along with the location on a map.

An easy-to-use, cross-platform measurement tool that pulls data out of CD pipelines and analysis the four key metrics for you.
Maintained by SEA team, ThoughtWorks Inc. Read this in other languages: English, 简体中文 Table of Contents About the Project Usage How to Compute Contrib

Android Tableau library supports variety of graphs which developers simply integrate visualization reports on Android application.
Android Tableau Library Android Tableau library supports variety of graphs which developers simply integrate visualization reports on Android applicat

An app performance monitor(APM) , like "Android Studio profiler", you can easily monitor the performance of your app real time in browser
AndroidGodEye English README.md 中文 README_zh.md Android developer lack of monitoring of performance data,especially in production environment. so we n

An open source Android library that allows the visualization of large images with gesture capabilities
ByakuGallery ByakuGallery is an open source Android library that allows the visualization of large images with gesture capabilities. This lib is based

A Music Player for android that renders beautiful DNA(Visualization) of the currently playing music.
MusicDNA - A Music Player like no other A Music Player for android that makes use of the Visualizer Class for rendering a beautiful DNA (Visualization

Horizon - Simple visual equaliser for Android
Horizon - Simple visual equaliser for Android This project aims to provide pretty cool equaliser for any Android audio project. Made in [Yalantis] (ht

Simple star rating system bars, a view similar to the ones seen on Google Playstore. ⭐🌟✨
RatingReviews RatingReviews (Rating and Reviews) is a widget and layout that adds a "Rating & Reviews" bar to your app, similar to the ones seen on Go
AnyChart Android Chart is an amazing data visualization library for easily creating interactive charts in Android apps. It runs on API 19+ (Android 4.4) and features dozens of built-in chart types.
AnyChart for Android AnyChart Android Charts is an amazing data visualization library for easily creating interactive charts in Android apps. It runs