AnyChart Android Chart is an amazing data visualization library for easily creating interactive charts in Android apps. It runs on API 19+ (Android 4.4) and features dozens of built-in chart types.

Overview

AnyChart - Robust JavaScript/HTML5 Chart library for any project

AnyChart for Android

API

AnyChart Android Charts is an amazing data visualization library for easily creating interactive charts in Android apps. It runs on API 19+ (Android 4.4) and features dozens of built-in chart types.

Check out getting started.

Installation

Gradle

Add this to the root build.gradle at the end of repositories (WARNING: Make sure you add this under allprojects not under buildscript):

allprojects {
        repositories {
                ...
                maven { url 'https://jitpack.io' }
        }
}

Add the dependency to the project build.gradle:

dependencies {
        implementation 'com.github.AnyChart:AnyChart-Android:1.1.2'
}

JAR/AAR File

Copy AAR file into the libs folder of the application project.

If you are using Android Studio:

  1. Right click on a project and choose "Open Module Settings".
  2. Click the plus button in the top left to add a new module.
  3. Choose "Import .JAR or .AAR Package".
  4. Find the AAR file.
  5. In the app's module click on the dependencies tab and add the new module as a dependency.

Chart Types

AnyChart product family includes scores of chart types and we're constantly adding new ones.

Pie Chart


Pie Chart - AnyChart Sample app / Code Snippet

Column Chart


Column Chart - AnyChart Sample app / Code Snippet

Line Chart


Line Chart - AnyChart Sample app / Code Snippet

Venn Diagram


Venn Diagram - AnyChart Sample app / Code Snippet

Radar Chart


Radar Chart - AnyChart Sample app / Code Snippet

Tag Cloud


Tag Cloud - AnyChart Sample app / Code Snippet

Heat Map Chart


Heat Map Chart - AnyChart Sample app / Code Snippet

Waterfall Chart


Waterfall Chart - AnyChart Sample app / Code Snippet

Tree Map Chart


Tree Map Chart - AnyChart Sample app / Code Snippet

Scatter Chart


Scatter Chart - AnyChart Sample app / Code Snippet

Resource Chart


Resource Chart - AnyChart Sample app / Code Snippet

Range Chart


Range Chart - AnyChart Sample app / Code Snippet

Vertical Chart


Vertical Chart - AnyChart Sample app / Code Snippet

Funnel Chart


Funnel Chart - AnyChart Sample app / Code Snippet

Pert Chart


Pert Chart - AnyChart Sample app / Code Snippet

Polar Chart


Polar Chart - AnyChart Sample app / Code Snippet

Pyramid Chart


Pyramid Chart - AnyChart Sample app / Code Snippet

Bubble Chart


Bubble Chart - AnyChart Sample app / Code Snippet

Area Chart


Area Chart - AnyChart Sample app / Code Snippet

Bar Chart


Bar Chart - AnyChart Sample app / Code Snippet

Box Chart


Box Chart - AnyChart Sample app / Code Snippet

Mosaic Chart


Mosaic Chart - AnyChart Sample app / Code Snippet

Mekko Chart


Mekko Chart - AnyChart Sample app / Code Snippet

3D Bar Chart


3D Bar Chart - AnyChart Sample app / Code Snippet

3D Column Chart


3D Column Chart - AnyChart Sample app / Code Snippet

3D Area Chart


3D Area Chart - AnyChart Sample app / Code Snippet

Circular Gauge


Circular Gauge Sample app / Code Snippet

Pareto Chart


Pareto Chart - AnyChart Sample app / Code Snippet

Combined Chart


Combined Chart - AnyChart Sample app / Code Snippet

Quadrant Chart


Quadrant Chart - AnyChart Sample app / Code Snippet

Hilo Chart


Hilo Chart - AnyChart Sample app / Code Snippet

OHLC Chart


OHLC Chart - AnyChart Sample app / Code Snippet

Bubble Map


Bubble Map - AnyChart Sample app / Code Snippet

Choropleth Map


Choropleth Map - AnyChart Sample app / Code Snippet

Point Map


Point Map - AnyChart Sample app / Code Snippet

Connector Map


Connector Map - AnyChart Sample app / Code Snippet

Sunburst Chart


Sunburst Chart - AnyChart Sample app / Code Snippet

Thermometer


Thermometer - AnyChart Sample app / Code Snippet

Linear Color Scale


Linear Color Scale - AnyChart Sample app / Code Snippet

Wind Speed Chart


Wind Speed - AnyChart Sample app / Code Snippet

Wind Direction


Wind Direction - AnyChart Sample app / Code Snippet
 

Contacts

Links

License

© AnyChart.com - JavaScript charts. All rights reserved.

Comments
  • Unable to create Map after updating from 0.30 to 1.0.8 version.

    Unable to create Map after updating from 0.30 to 1.0.8 version.

    I recently changed the version of the library. And also changed the code accordingly.

    I was able to display the map in the last version. But in this version it is empty. I don't understand where am i doing wrong. Here is the code:

     Map map = AnyChart.map();
        
        chartRegionView.setZoomEnabled(false);
        chartRegionView.setEnabled(false);
    
    
      //  map.removeSeriesAt(0);
        //  chartRegionView.removeViewAt(0);
    
        if (AxesTrackApplication.getThemenew(context) == 0) {
    
            map.background("#292A35");
    
    
            map.unboundRegions()
                    .enabled(true)
                    .fill("#385454", 1)
                    .stroke("#385454");
        } else {
            map.background("#DAEDED");
    
    
            map.unboundRegions()
                    .enabled(true)
                    .fill("#78B3C0", 1)
                    .stroke("#78B3C0");
        }
    
        map.geoData("anychart.maps.asia");
        map.interactivity().drag(false);


        Marker series = map.marker(getDataMap());
    
    
        series.tooltip()
                .useHtml(true)
                .padding(8, 13, 10, 13)
                .title(false)
                .fontSize(14)
                .format("function() {\n" +
                        "            return '<span>' + this.getData('name') + '</span><br/>' +\n" +
                        "              '<span style=\"font-size: 12px; color: #E1E1E1\">City: ' +\n" +
                        "              this.getData('city') + '</span>';\n" +
                        "          }");
    
        series.tooltip(false);
    
        series.size(5)
                .labels(false);
    
        if (AxesTrackApplication.getThemenew(context) == 0) {
            series.stroke("2 #E1E1E1")
                    .fill("#1976d2", 1);
        } else {
            series.stroke("2 #E1E1E1")
                    .fill("#1976d2", 1);
        }
    
    
        series.selectionMode(SelectionMode.NONE);
    
    
       // map.zoomTo(2, 100, 100);
    
        chartRegionView.addScript("file:///android_asset/asiaaa.js");
    
        chartRegionView.addScript("file:///android_asset/proj4.js");
    
    
        //map.zoom(7,0,0,1);
    
    
        //map.move(300,0);
    
        LogUtils.debug("DashboardMAp", "Creating chart");
    
        
        chartRegionView.setChart(map);
    
    opened by aadesh0118 16
  • Can't replace data in Pie Chart

    Can't replace data in Pie Chart

    Hi! I'm using the AnyChart trial version and I am trying to implement a PieChart whose data changes when the user selects an option from a dropdown menu. When an option is selected the app calls the server for the new information, but unfortunately the data in my PieChart remains the same.

    Here is the code I'm using:

    ` @Override public void onViewCreated(View view, Bundle savedInstanceState) { .... AnyChartView salesDistributionChart = activity.findViewById(R.id.sales_distribution_chart); APIlib.getInstance().setActiveAnyChartView(salesDistributionChart);

    final Pie salesDistributionPie = AnyChart.pie();
    
    salesDistributionPie.palette(ColorTemplate.DOMAIN_COLORS_TEXT);
    
    salesDistributionPie.labels().enabled(false);
    
    salesDistributionPie.legend()
    	.position("bottom")
    	.itemsLayout(LegendLayout.HORIZONTAL_EXPANDABLE)
    	.align(Align.BOTTOM);
    
    salesDistributionChart.setChart(salesDistributionPie);
    
        .....
    
        projectsSpinner.setItems(projectList, 0, new SpinnerListener() {
    	@Override
    	public void onItemsSelected(List<KeyPairBoolData> list) {
    		for (int i = 0; i < list.size(); i++) {
    			if (list.get(i).isSelected()) {
    				
    				setupGraphsByProject(list.get(i).getId(), salesDistributionPie);
    				}
    		}
    	}
    });
    
       .....
    
        }
    
        protected void setupGraphsByProject(long id, final Pie salesDistributionPie) {
    	Retrofit retrofit = ApiClient.getInstance(activity).getRetrofit();
    	StatisticsService statisticsService = retrofit.create(StatisticsService.class);
    
    	int agencyId = Integer.parseInt(Storage.getAgencyId(activity));
    	final Integer projectId;
    
    	if (id > 0) {
    		projectId = (int) id;
    	} else {
    		projectId = null;
    	}
    
    	Call<StatisticsFinancialDetails> financialStatsCall = statisticsService.getFinancialStats(
    		agencyId,
    		projectId
    	);
                financialStatsCall.enqueue(new DefaultApiCallback<StatisticsFinancialDetails>(activity, TAG) {
    		@Override
    		public void onResponseSuccess(final StatisticsFinancialDetails responseBody,
    									  Call<StatisticsFinancialDetails> call, okhttp3.Headers headers) {
                         List<DataEntry> data = new ArrayList<>();
    		data.add(new ValueDataEntry ( activity.getResources().getString(R.string.unscheduled), responseBody.getPayments().getUnscheduledValue()));
    		data.add(new ValueDataEntry ( activity.getResources().getString(R.string.unpaid), responseBody.getPayments().getNotPayedValue()));
    		data.add(new ValueDataEntry ( activity.getResources().getString(R.string.paid), responseBody.getPayments().getPayedValue()));
    		data.add(new ValueDataEntry ( activity.getResources().getString(R.string.available), responseBody.getPayments().getAvailableValue()));
    		data.add(new ValueDataEntry ( activity.getResources().getString(R.string.discount), responseBody.getPayments().getDiscountValue()));
    
    		salesDistributionPie.data(data);
                  }
         }
    

    `

    I have tried to implement the code from here as is, but nothing changes in the chart.

    Any help on this will be very appreciated. Thank you.

    opened by laurachelaru 10
  • App crash in API 25.

    App crash in API 25.

    getting this issue: android.view.InflateException: Binary XML file line #9: Error inflating class com.anychart.AnyChartView

    how to fix this issue?

    Thanks

    opened by iji56 8
  • NullPointerException

    NullPointerException

    Hello,

    I wanted to say that this library is really great but it suddenly stopped working with the following exception:

    java.lang.NullPointerException: Attempt to invoke virtual method 'com.anychart.AnyChartView$JsListener com.anychart.AnyChartView.getJsListener()' on a null object reference

    This exception shows up on this line:

    Pie pie = AnyChart.pie();

        java.lang.NullPointerException: Attempt to invoke virtual method 'com.anychart.AnyChartView$JsListener com.anychart.AnyChartView.getJsListener()' on a null object reference
            at com.anychart.APIlib.addJSLine(APIlib.java:27)
            at com.anychart.charts.Pie.<init>(Pie.java:34)
            at com.anychart.AnyChart.pie(AnyChart.java:130)
            at com.example.fitpoint.ProfileCreationActivity.setUpChart(ProfileCreationActivity.java:104)
    

    I swear it was working like 3 days ago. Now I have no idea what could possibly cause this.

    opened by ddz95 7
  • Change column colour base on value

    Change column colour base on value

    WhatsApp Image 2019-10-11 at 10 28 57 AM

    As shown in the picture, all columns describe the same type of data. However, I want to change the colour of those columns base on their values. For example, column with value from 1-5 should be blue, 5-10 should be orange, etc

    How would I implement such a feature using AnyChart?

    opened by giangpham96 7
  • Is it possible to import data from a CSV or JSON file into AnyChart Android?

    Is it possible to import data from a CSV or JSON file into AnyChart Android?

    I could only see the documentation referring to JavaScript. I was hoping for an example showing how to import the data then display the data in a chart. Any help would be greatly appreciated.

    opened by liamEscher 7
  • How to plot pie chart with changing data on user click?

    How to plot pie chart with changing data on user click?

    I m using the trial version , and trying to plot pie chart.....In my case the data for pie chart changes on user click. Please tell me how to implement this thing. What is happening now is that the first data that i used to set in pie, is getting permanent.....and whatever the data i set for next time does not work with pie chart. The piechart shows the same data of very first time.Please help `

    private void generateGraph(int unmarked,int absent,int present,int latePresent){ // these are absent, present of student Log.e( "unG",unmarked+"" ); Log.e( "abG",absent+"" ); Log.e( "PrG",present+"" ); Log.e( "LpG",latePresent+"" ); final Pie pie = AnyChart.pie();

        pie.setOnClickListener(new ListenersInterface.OnClickListener(new String[]{"x", "value"}) {
            @Override
            public void onClick(Event event) {
                Toast.makeText(getContext(), event.getData().get("x") + ":" + event.getData().get("value"), Toast.LENGTH_SHORT).show();
            }
        });
    
        List<DataEntry> data1 = new ArrayList<>();
        data1.add(new ValueDataEntry("Unmarked", unmarked));
        data1.add(new ValueDataEntry("Absent", absent));
        data1.add(new ValueDataEntry("Present", present));
        data1.add(new ValueDataEntry("LatePresent", latePresent));
    
        pie.data(data1);
    
        pie.title("Attendance Chart ");
        pie.legend()
                .position("center")
                .itemsLayout( LegendLayout.HORIZONTAL)
                .align( Align.CENTER);
        anyChartView.setChart(pie);
    }`
    
    opened by Jeetin9410 7
  •  is it possible to use lists ValueDataEntry extended class?

    is it possible to use lists ValueDataEntry extended class?

    My intenstion is to use dataset that created dynamically, is it possible to use lists ValueDataEntry extended class? like this

    private class CustomDataEntry extends ValueDataEntry {
            CustomDataEntry(String x, List<String> values) {
                super(x, values);
            }
    }
    

    if possible how? Need mapping pattern for lists?

    opened by bewithdhanu 7
  • change Legend name in Cartesian chart

    change Legend name in Cartesian chart

    Hi @chidori

    Screenshot_1596713546

    How can i change series name in legend and as well as in tooltip. for legend enable i usecartesian.legend().align(Align.CENTER).enabled(true);

    Capture Capture2

    is there any solution for this then help me. Thanks(_).

    opened by GauravCreed 6
  • Linechart doesn't render in Fragment

    Linechart doesn't render in Fragment

    I'm using a TabLayout + ViewPager with two Fragments that should contain an AnyChart. When the Fragment is created I call an Asynctask, that prepares the data for the AnyChart. After the background-task the data should displayed in the AnyChart.

    But i only get this: image

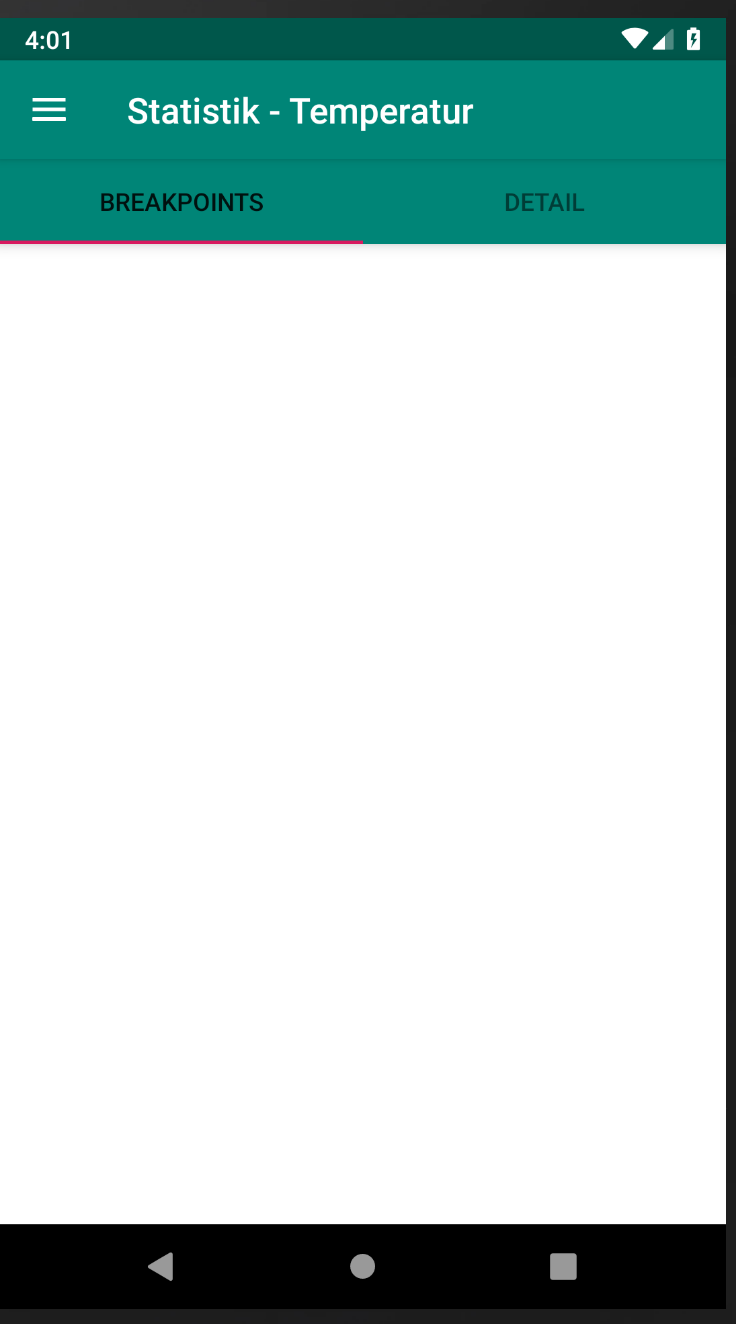
    Instead of something like this: image

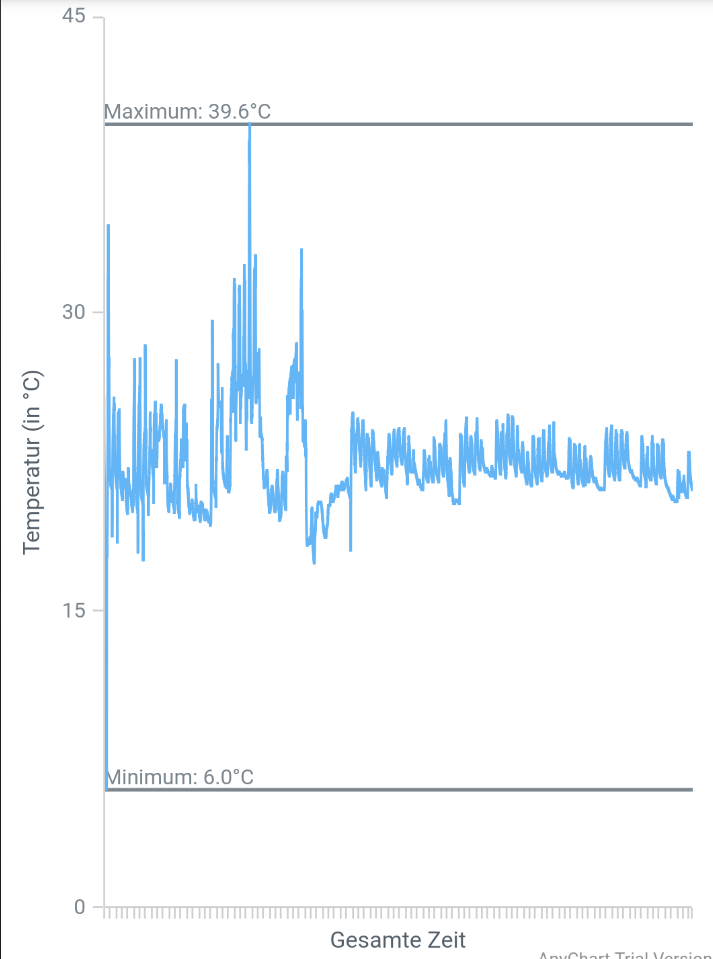
    This are the TabLayout + ViewPager:

    public class TemperatureStatisticsFragment extends Fragment {
        @Nullable
        @Override
        public View onCreateView(@NonNull LayoutInflater inflater, @Nullable ViewGroup container, @Nullable Bundle savedInstanceState) {
            return inflater.inflate(R.layout.statistics_temperature_fragment, container, false);
        }
    
        @Override
        public void onViewCreated(@NonNull View view, @Nullable Bundle savedInstanceState) {
            super.onViewCreated(view, savedInstanceState);
    
            Objects.requireNonNull(getActivity()).setTitle("Statistik - Temperatur");
    
            TabLayout tabLayout = (TabLayout) getActivity().findViewById(R.id.tab_layout);
            tabLayout.addTab(tabLayout.newTab().setText("Breakpoints"));
            tabLayout.addTab(tabLayout.newTab().setText("Detail"));
            tabLayout.setTabGravity(TabLayout.GRAVITY_FILL);
    
    
            final ViewPager viewPager = (ViewPager) getActivity().findViewById(R.id.pager);
            final TemperaturePagerAdapter adapter = new TemperaturePagerAdapter
                    (getActivity().getSupportFragmentManager(), tabLayout.getTabCount());
            viewPager.setAdapter(adapter);
            viewPager.addOnPageChangeListener(new TabLayout.TabLayoutOnPageChangeListener(tabLayout));
            tabLayout.setOnTabSelectedListener(new TabLayout.OnTabSelectedListener() {
                @Override
                public void onTabSelected(TabLayout.Tab tab) {
                    viewPager.setCurrentItem(tab.getPosition());
                }
    
                @Override
                public void onTabUnselected(TabLayout.Tab tab) {
    
                }
    
                @Override
                public void onTabReselected(TabLayout.Tab tab) {
    
                }
            });
        }
    }
    

    Here is one of the Tabs/Fragments that need to display the AnyChart:

    public class TemperatureFragmentTab1 extends Fragment {
    
        @Override
        public View onCreateView(LayoutInflater inflater, ViewGroup container, Bundle savedInstanceState) {
            return inflater.inflate(R.layout.statistics_temperature_fragment_tab_1, container, false);
        }
    
        @Override
        public void onViewCreated(@NonNull View view, @Nullable Bundle savedInstanceState) {
            super.onViewCreated(view, savedInstanceState);
    
            AnyChartView anyChartView = Objects.requireNonNull(getActivity()).findViewById(R.id.any_chart_view_temperature_tab_1);
            APIlib.getInstance().setActiveAnyChartView(anyChartView);
            ProgressBar progressBar = Objects.requireNonNull(getActivity()).findViewById(R.id.loadingProgressBar_temperature_tab_1);
            TextView progressText = getActivity().findViewById(R.id.loadingProgressText_temperature_tab_1);
            ProgressBar progressSpinner = Objects.requireNonNull(getActivity()).findViewById(R.id.loadingProgress_temperature_tab_1);
    
            new LongOperation(anyChartView, progressSpinner, progressBar, progressText).execute();
        }
    }
    

    Here is the background task, that prepares the data and draw the AnyChart after finishing that:

    public class LongOperation extends AsyncTask<Void, Integer, List<DataEntry>> {
    
        private AnyChartView anyChartView;
    
        private ProgressBar progressSpinner;
        private ProgressBar progressBar;
        private TextView progressText;
    
        private List<Double> values;
    
        public LongOperation(AnyChartView anyChartView, ProgressBar progressSpinner, ProgressBar progressBar, TextView progressText) {
            this.anyChartView = anyChartView;
            this.progressSpinner = progressSpinner;
            this.progressBar = progressBar;
            this.progressText = progressText;
        }
    
        @Override
        protected void onPreExecute() {
            progressBar.setVisibility(View.VISIBLE);
            progressBar.setMax(Device.getDevices().get(0).getRecordsCount()); // hier muss noch - 1 gerechnet werden
            progressBar.setProgress(0);
    
            progressText.setText("Loading Resources...");
    
            progressSpinner.setVisibility(View.VISIBLE);
        }
    
        @Override
        protected void onProgressUpdate(Integer... values) {
            super.onProgressUpdate(values);
            progressBar.setProgress(values[0]);
            progressText.setText("Loading Resources: " + String.valueOf(progressBar.getProgress()) + " / " + String.valueOf(progressBar.getMax()));
        }
    
        @Override
        protected List<DataEntry> doInBackground(Void... params) {
            Device device = Device.getDevices().get(0);
            List<DataEntry> data = new ArrayList<>();
            values = new ArrayList<Double>();
            for (int i=0; i < device.getRecordsCount(); i++) {
                publishProgress(i);
                double temperature = 0;
                String timestamp = "";
                try {
                    temperature = device.getRecord(i).getDouble("Temperature");
                    timestamp = device.getRecord(i).getString("Timestamp");
                } catch (JSONException e) {
                    e.printStackTrace();
                }
                values.add(temperature);
                data.add(new ValueDataEntry(timestamp, temperature));
            }
            return data;
        }
    
        @Override
        protected void onPostExecute(List<DataEntry> data) {
            Cartesian line = AnyChart.line();
    
            line.animation(true);
    
            // set data into series
            com.anychart.core.cartesian.series.Line series = line.line(data);
            series.tooltip().format("Temperatur: {%value}°C");
    
            com.anychart.core.axismarkers.Line lineMarkerMin = line.lineMarker(0);
            lineMarkerMin.value(Statistic.getMinValue(values));
    
            com.anychart.core.axismarkers.Line lineMarkerMax = line.lineMarker(1);
            lineMarkerMax.value(Statistic.getMaxValue(values));
    
            Text textMarkerMin = line.textMarker(0);
            textMarkerMin.value(Statistic.getMinValue(values));
            textMarkerMin.text("Minimum: " + Double.toString(Statistic.getMinValue(values)) + "°C");
            textMarkerMin.anchor("left-bottom");
            textMarkerMin.align("left");
    
            Text textMarkerMax = line.textMarker(1);
            textMarkerMax.value(Statistic.getMaxValue(values));
            textMarkerMax.text("Maximum: " + Double.toString(Statistic.getMaxValue(values)) + "°C");
            textMarkerMax.anchor("left-bottom");
            textMarkerMax.align("left");
    
            // disable x axis labels and title adjusting
            line.xAxis(0).labels(false);
            line.xAxis(0).title("Gesamte Zeit");
    
            // adjusting y axis title
            line.yAxis(0).title("Temperatur (in °C)");
    
            line.draw(true);
    
            anyChartView.setChart(line);
    
            progressBar.setVisibility(View.INVISIBLE);
            progressText.setVisibility(View.INVISIBLE);
            progressSpinner.setVisibility(View.INVISIBLE);
        }
    }
    

    I hope you can help me with that Problem, because I spent hours on this without any clue how to fix it.

    opened by Moritz-David 6
  • is there a callback method to find out that the chart loading and rendering is complete?

    is there a callback method to find out that the chart loading and rendering is complete?

    For large data, the chart rendering takes quite some time. How can we perform tasks with surety that the graph loading is indeed complete?

    I believe if we modify the code a little and provide an interface that could be called from the JsListener in the AnyChartView class, this could be achieved. thoughts?

    opened by ihsanulhaq-saal-ai 6
  • Pie chart is flickering whenever new data is inserted

    Pie chart is flickering whenever new data is inserted

    I want to update the pie chart from the data from a local database whenever I press the button, but whenever I press it the chart is flickering with old and new data. Here's my code.

    pie = AnyChart.pie();
    AnyChartView anyChartView = binding.anyChartView;
    anyChartView.setChart(pie);
    
    binding.getPieChartBtn.setOnClickListener(v -> {
    //   amountForCategory array is retrieved from database whenever button is clicked
            final int delayMillis = 500;
            final Handler handler = new Handler();
            final Runnable runnable = new Runnable() {
                public void run() {
                    List<DataEntry> data = new ArrayList<>();
                    if(amountForCategory[0]!=0) data.add(new ValueDataEntry("Food", amountForCategory[0]));
                    if(amountForCategory[1]!=0) data.add(new ValueDataEntry("Transportation", amountForCategory[1]));
                    if(amountForCategory[2]!=0) data.add(new ValueDataEntry("Rent", amountForCategory[2]));
                    if(amountForCategory[3]!=0) data.add(new ValueDataEntry("Medicine", amountForCategory[3]));
                    if(amountForCategory[4]!=0) data.add(new ValueDataEntry("Other", amountForCategory[4]));
                    pie.data(data);
            
            
                    handler.postDelayed(this, delayMillis);
                }
            };
            handler.postDelayed(runnable, delayMillis);
            });
    
    opened by zaidnaseer 0
  • Cannot resolve symbol 'AnyChartView' in Android Studio version Arctic Fox |2020.3.1 Patch 3

    Cannot resolve symbol 'AnyChartView' in Android Studio version Arctic Fox |2020.3.1 Patch 3

    I can't use the AnyChart library . I always get Cannot resolve symbol 'AnyChartView'

    I added this line in my dependency implementation 'com.github.AnyChart:AnyChart-Android:1.1.2' Also I added this in my gradle file maven { url 'https://jitpack.io' } to be like this

    buildscript {
        repositories {
            google()
            mavenCentral()
            maven { url 'https://jitpack.io' }
        }
        dependencies {
            classpath "com.android.tools.build:gradle:7.0.3"
    
            // NOTE: Do not place your application dependencies here; they belong
            // in the individual module build.gradle files
        }
    }
    

    image

    opened by AhmedElsayedTaha 0
  • tree chart is showing on activity but not showing in fragment

    tree chart is showing on activity but not showing in fragment

    hello , i am using any chart trial version 1.1.2 this code is working on activity and the chart is showing but when i use exactly same code in a fragment that is inside a viewpager a white screen is showing whit out any chart trial version lable and nothing show up. i have logged data and evry thing is okey . i dont see any log message from any chart in log cat

    if i update library to 1.1.3 or 1.1.4 the chart wont show up even on activity . even with your sample code . https://github.com/AnyChart/AnyChart-Android/blob/master/sample/src/main/java/com/anychart/sample/charts/TreeMapChartActivity.java

    this is the code that i am using on activity and chart is showing . but on the fragment after getting data from live data i do the same thing and only a white screen is showing

    `class TreeChartActivity : BaseActivityNew() {

    private val marketStatVM by viewModels<MarketStatViewModel>()
    var marketStats = ArrayList<MarketStat>()


    override fun onCreate(savedInstanceState: Bundle?) {
        super.onCreate(savedInstanceState)
        marketStatVM.irtMarketsLiveData.observe(this) {
            marketStats.clear()
            marketStats.addAll(it)
            val treeMap: TreeMap = AnyChart.treeMap()
            val data: MutableList<DataEntry> = ArrayList()
            data.add(CustomTreeDataEntry("Markets", "Markets By Value", "Markets"))
            marketStats.forEach {
                val price =formatDoubleNew(it.latest,Precisions.getAmountPreciousByCurrency(it.srcCurrency),DoubleType.AMOUNT,true)
                data.add(CustomTreeDataEntry(it.srcCurrency,"Markets",it.srcCurrency.uppercase()+"/"+it.dstCurrency.uppercase(),
                    it.volumeDst, it.dayChange,getColorByPercent(it.dayChange,
                    ),   price
                 ))
            }
            treeMap.data(data, TreeFillingMethod.AS_TABLE)
            treeMap.colorScale()
            treeMap.padding(0, 0, 50.0, 0)
            treeMap.maxDepth(2.0)
            treeMap.hovered().fill("#bdbdbd", 0.8)
            treeMap.selectionMode(SelectionMode.NONE)
    
            treeMap.labels().useHtml(true)
            treeMap.labels().fontColor("#121212")
            treeMap.labels().fontSize(12.0)
    
            treeMap.labels().format(
                "function() {\n" +
                        "var name = this.getData('product')\n"+
                        "var price = this.getData('extra')\n"+
                        "var value = this.getData('value')\n"+
                        "var all = name + '-'+price + '-' + value+'%'\n"+
                        "      return all;\n" +
                        "    }"
            )
    
            treeMap.headers().format(
                ("function() {\n" +
                        "    return this.getData('product');\n" +
                         "  }")
            )
    
            treeMap.tooltip()
                .useHtml(true)
                .titleFormat("function() {\n" +
                        "       return this.getData('extra');\n" +
                        "    }")
                .format(
                    ("function() {\n" +
                            "       return this.getData('extra');\n" +
                            "    }")
                )
    
            binding.anyChart.setChart(treeMap)
    
        }
    
    }
    
    private fun getColorByPercent(percent:Float) : String{
        when {
            percent < -5 -> {
                return "#BE464E"
            }
            percent < -4 && percent >=-5 ->{
                return "#EE5862"
            }
            percent < -3 && percent >=-4 ->{
                return "#F17981"
            }
            percent < -2 && percent >=-3 ->{
                return "#F49AA0"
            }
    
            percent < -1 && percent >=-2 ->{
                return "#F8BCC0"
            }
    
            percent < 0 && percent >=-1 ->{
                return "#FBDDDF"
            }
            percent == 0f -> {
                return "#b3b3be"
            }
            percent > 0 && percent <=1 ->{
                return "#D2F3F1"
            }
            percent > 1 && percent <=2 ->{
                return "#A5E7E3"
            }
            percent > 2 && percent <=3 ->{
                return "#79DCD5"
            }
            percent > 3 && percent <=4 ->{
                return "#4CD0C7"
            }
            percent > 4 && percent <=5 ->{
                return "#20C5BA"
            }
            percent > 5 ->{
                return "#199D94"
            }else-> {
            return "#b3b3be"
        }
    
        }
    }
    
    override fun getViewBinding(): ActivityTreeChartBinding {
        return  ActivityTreeChartBinding.inflate(layoutInflater)
    }
    
    override fun getToolbar(): Toolbar? {
        return null
    }
    
     class CustomTreeDataEntry : TreeDataEntryCustom {
        internal constructor(
            id: String?,
            parent: String?,
            product: String?,
            size : Number,
            value: Number?,
            fill:String,
            extra:String
        ) : super(id, parent,size, value) {
            setValue("product", product)
            setValue("fill", fill)
            setValue("extra", extra)
        }
    
        internal constructor(id: String?, parent: String?, product: String?) : super(id, parent) {
            setValue("product", product)
        }
    }
    

    }`

    opened by hrgdeveloper 1
  • Build issue: Manifest merger failed with multiple errors

    Build issue: Manifest merger failed with multiple errors

    Hi I got this error in Build log while trying to run the app.

    image

    The dependency used is implementation 'com.github.AnyChart:AnyChart-Android:1.1.2'

    However, it resolved when I upgraded the dependency to implementation 'com.github.AnyChart:AnyChart-Android:1.1.4'

    I just want to post this issue in case someone else encounters the same error.

    The README will need an update mentioning the latest dependency. Please assign the issue to me so I could make a Pull request with the change in README

    opened by venusaim23 0
Owner
AnyChart
Robust JavaScript/HTML5 Chart library for any project
AnyChart
Open-source native Android graph/chart framework includes line chart,stick chart,candlestick chart,pie chart,spider-web chart etc.

Welcome to Android-Charts Welcome to Android-Charts project page on github.com. We just moved from Google Code. Android-Charts is an open-source andro

limc.cn 813 Dec 20, 2022
Charts/graphs library for Android compatible with API 8+, several chart types with support for scaling, scrolling and animations

HelloCharts for Android Charting library for Android compatible with API 8+(Android 2.2). Works best when hardware acceleration is available, so API 1

Leszek Wach 7.4k Jan 6, 2023
Android library for drawing Pie charts and Donut charts with the ability to customize almost anything in it.

A Pie/Donut*/Ring chart for Android, customizable to the most extent possible. For tutorial and examples refer to the website. build.gradle[.kts] impl

Mahdi Hosseinzadeh 20 Nov 18, 2022
A powerful 🚀 Android chart view / graph view library, supporting line- bar- pie- radar- bubble- and candlestick charts as well as scaling, panning and animations.

⚡ A powerful & easy to use chart library for Android ⚡ Charts is the iOS version of this library Table of Contents Quick Start Gradle Maven Documentat

Philipp Jahoda 36k Dec 31, 2022
Straiberry Charts - An awesome Chart library for android

Straiberry Charts An awesome Chart library for android Straiberry · Report Bug · Request Feature Getting Started Adding dependecies Add it in your roo

StrAIberry 30 Dec 30, 2022
Arc Chart View (Draw Creative Statistic Arc Charts)

ArcChartViewDemo You can use this library to draw Arc charts and show your statistics or anything you want or maybe get some ratings from user. you ca

Iman khoshabi 106 Nov 22, 2022
Jetpack-linear-chart - A simple way to draw linear chart using Jetpack Compose

jetpack-linear-chart A simple way to draw linear chart using Jetpack Compose We

Bruno Gabriel dos Santos 8 Jan 4, 2023
Data2Viz port/wrapper for data visualization with Jetpack Compose

Collage Data2Viz port/wrapper for Jetpack Compose. It is a visualization library, same as Data2Viz and d3. This is obviously not an official Data2Viz

Prat 11 Dec 5, 2022
Donut is an Android library which helps you to easily create beautiful doughnut-like charts.

Doughnut-like graph view capable of displaying multiple datasets with assignable colors

Futured 509 Jan 3, 2023
Android Tableau library supports variety of graphs which developers simply integrate visualization reports on Android application.

Android Tableau Library Android Tableau library supports variety of graphs which developers simply integrate visualization reports on Android applicat

Sung Hyun 54 Jan 1, 2023
A basic chart written by kotlin. Support animation loading, touch event monitoring and JSON data.

A basic chart written by kotlin. Support animation loading, touch event monitoring and JSON data.

null 2 Dec 21, 2022
Android Library to rapidly develop attractive and insightful charts in android applications.

williamchart Williamchart is an Android Library to rapidly implement attractive and insightful charts in android applications. Note: WilliamChart v3 h

Diogo Bernardino 4.9k Dec 30, 2022
Android Library to rapidly develop attractive and insightful charts in android applications.

williamchart Williamchart is an Android Library to rapidly implement attractive and insightful charts in android applications. Note: WilliamChart v3 h

Diogo Bernardino 4.8k Dec 22, 2021
An android compose library with different Graphs and Charts

plot An android compose library with different Graphs and Charts (currently supports only Line graph, more types will be added soon) Download reposito

Madrapps 106 Dec 30, 2022
An open source library used to draw charts in Android with Jetpack Compose with a simple and easy to use

android-compose-charts This is an open source library used to draw charts in Android with Jetpack Compose with a simple and easy to use. Just couples

Mahmoud Ibrahim 17 Dec 31, 2022
An easy-to-use Android charts library with animation.

AndroidCharts A simple Android charts library. Known Uses in Pomotodo Including in Your Project Eclipse Import /AndroidCharts folder. Move /java folde

HackPlan 1.3k Jan 2, 2023
YBKChart is a library of 3D graphics charts for Android. 📊

YBKChart is a library of 3D graphics charts for Android. ?? For more information, see the Wiki. Chart List Pie Chart Download Use gradle. rep

ByungKwan Yun 10 Jun 19, 2022
Library for charts in android with animations

Charts Gradle Setup Step 1. Add the JitPack repository to your build file Add it in your root build.gradle at the end of repositories: allprojects {

Ayush Saini 4 Dec 30, 2022