Android Library to rapidly develop attractive and insightful charts in android applications.

Overview

williamchart phonewatch

Kotlin Version API CodeFactor

Williamchart is an Android Library to rapidly implement attractive and insightful charts in android applications.

Note: WilliamChart v3 has been completely re-written from scratch in Kotlin and does not guarantee any API/features compatibility with previous versions. Android development has been evolving quickly, and much has changed since I first started developing williamchart (e.g patterns, testing, tools), so I decided it was time to rewrite it with all these new tools in mind. I intend to keep it as light and modular as possible.

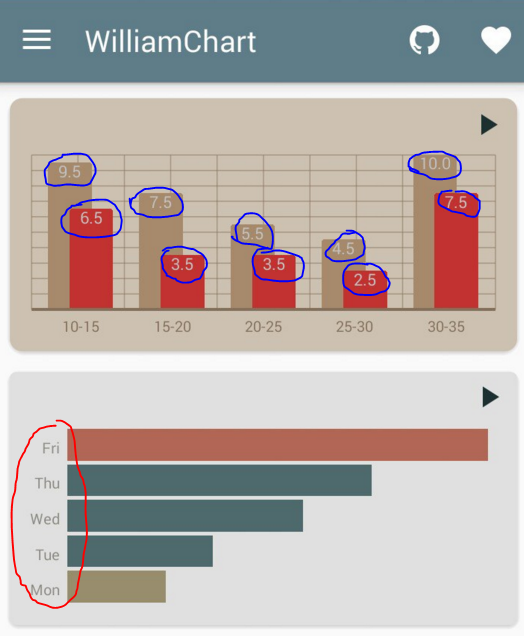
screenshot

Gradle

// Charts
implementation 'com.diogobernardino:williamchart:3.10.1'

// Tooltips
implementation 'com.diogobernardino.williamchart:tooltip-slider:3.10.1'
implementation 'com.diogobernardino.williamchart:tooltip-points:3.10.1'

If you find this library useful and decide to use it in your projects please drop me a line @dfbernardino, I will be happy to know about it.

Usage

All charts

<com.db.williamchart.view.chart_view
  ...
  app:chart_labelsColor="color"
  app:chart_labelsSize="dimension"
  app:chart_labelsFont="font" 
/>

Line Chart

<com.db.williamchart.view.LinechartView
  ...
  app:chart_lineColor="color"
  app:chart_lineThickness="dimension"
  app:chart_smoothLine=[ "true" | "false" ]
  app:chart_pointDrawable="drawable" 
/>

Bar Chart

<com.db.williamchart.view.BarChartView|HorizontalBarChartView
  ...
  app:chart_spacing="dimension"
  app:chart_barsColor="color"
  app:chart_barsBackgroundColor="color"
  app:chart_barsRadius="dimension" 
/>

Donut Chart

<com.db.williamchart.view.DonutChartView
  ...
  app:chart_donutThickness="dimension"
  app:chart_donutBackgroundColor="color"
  app:chart_donutRoundCorners="boolean"
  app:chart_donutTotal="float"
/>

License

Copyright 2019 Diogo Bernardino

Licensed under the Apache License, Version 2.0 (the "License");
you may not use this file except in compliance with the License.
You may obtain a copy of the License at

   http://www.apache.org/licenses/LICENSE-2.0

Unless required by applicable law or agreed to in writing, software
distributed under the License is distributed on an "AS IS" BASIS,
WITHOUT WARRANTIES OR CONDITIONS OF ANY KIND, either express or implied.
See the License for the specific language governing permissions and
limitations under the License.
Comments
  • Bars has covered labels

    Bars has covered labels

    Hi dev! Is it possible to make a bars do not lay on labels? It covers labels now. image I was playing with opacity, but it seems that bars are forced to be always solid.

    opened by kruil 17
  • Stop LineChartView from handling click

    Stop LineChartView from handling click

    I have a line chart in the background. But, it prevents me from clicking anything which is over the LineChartView. I tried even setting an overlapping dummy view. Still clicking behavior on that region is not working. How can I stop LineChartView from handling clicks?

    dev-branch 
    opened by kirtan403 13
  • can't import library using gradle

    can't import library using gradle

    I add to dependencies in build.gradle this compile 'com.db.williamchart:1. 7.0' but I get such message: scr_28_02_2015_15_25_38 How can i handle this problem? Btw same problem appears on some others libs. I'm using AndroidStudio 1.1.0 Please help me. Thank You
    opened by ZheKOs 13
  • LineChart IndexOutOfBoundsException

    LineChart IndexOutOfBoundsException

    I have IndexOutOfBoundsException when I'm trying add several Points(" ", 0) to lineSet and trying to show LineChartView

    java.lang.IndexOutOfBoundsException: Invalid index 1, size is 1 at java.util.ArrayList.throwIndexOutOfBoundsException(ArrayList.java:251) at java.util.ArrayList.get(ArrayList.java:304) at com.db.chart.view.YController.parseYPos(YController.java:282) at com.db.chart.view.ChartView$1.onPreDraw(ChartView.java:135) at android.view.ViewTreeObserver.dispatchOnPreDraw(ViewTreeObserver.java:671) at android.view.ViewRootImpl.performTraversals(ViewRootImpl.java:1818) at android.view.ViewRootImpl.doTraversal(ViewRootImpl.java:998) at android.view.ViewRootImpl$TraversalRunnable.run(ViewRootImpl.java:4212) at android.view.Choreographer$CallbackRecord.run(Choreographer.java:725) at android.view.Choreographer.doCallbacks(Choreographer.java:555) at android.view.Choreographer.doFrame(Choreographer.java:525) at android.view.Choreographer$FrameDisplayEventReceiver.run(Choreographer.java:711) at android.os.Handler.handleCallback(Handler.java:615) at android.os.Handler.dispatchMessage(Handler.java:92) at android.os.Looper.loop(Looper.java:137) at android.app.ActivityThread.main(ActivityThread.java:4745) at java.lang.reflect.Method.invokeNative(Native Method) at java.lang.reflect.Method.invoke(Method.java:511) at com.android.internal.os.ZygoteInit$MethodAndArgsCaller.run(ZygoteInit.java:786) at com.android.internal.os.ZygoteInit.main(ZygoteInit.java:553) at dalvik.system.NativeStart.main(Native Method)

    help wanted 
    opened by ArtemGulia 13
  • UninitializedPropertyAccessException when used in Java project

    UninitializedPropertyAccessException when used in Java project

    I tried to put the chart from the example app into my own app, but it crashes as soon as I open the fragment that the chart is on. The exception: kotlin.UninitializedPropertyAccessException: lateinit property data has not been initialized at com.db.williamchart.renderer.BarChartRenderer.preDraw(BarChartRenderer.kt:67) at com.db.williamchart.view.BarChartView$$special$$inlined$doOnPreDraw$1.onPreDraw(View.kt:348) at android.view.ViewTreeObserver.dispatchOnPreDraw(ViewTreeObserver.java:977) at android.view.ViewRootImpl.performTraversals(ViewRootImpl.java:2337) at android.view.ViewRootImpl.doTraversal(ViewRootImpl.java:1386) at android.view.ViewRootImpl$TraversalRunnable.run(ViewRootImpl.java:6733) at android.view.Choreographer$CallbackRecord.run(Choreographer.java:911) at android.view.Choreographer.doCallbacks(Choreographer.java:723) at android.view.Choreographer.doFrame(Choreographer.java:658) at android.view.Choreographer$FrameDisplayEventReceiver.run(Choreographer.java:897) at android.os.Handler.handleCallback(Handler.java:789) at android.os.Handler.dispatchMessage(Handler.java:98) at android.os.Looper.loop(Looper.java:164) at android.app.ActivityThread.main(ActivityThread.java:6541) at java.lang.reflect.Method.invoke(Native Method) at com.android.internal.os.Zygote$MethodAndArgsCaller.run(Zygote.java:240) at com.android.internal.os.ZygoteInit.main(ZygoteInit.java:767) My relevant code: @Override public void onViewCreated(@NonNull View view, @Nullable Bundle savedInstanceState) { super.onViewCreated(view, savedInstanceState); LinkedHashMap<String, Float> lineMap = new LinkedHashMap<>(); lineMap.put("label1", 5f); lineMap.put("label2", 4.5f); lineMap.put("label3", 4.7f); lineMap.put("label4", 3.5f); lineMap.put("label5", 3.6f); lineMap.put("label6", 7.5f); lineMap.put("label7", 7.5f); lineMap.put("label8", 10f); lineMap.put("label9", 5f); lineMap.put("label10", 6.5f); lineMap.put("label11", 3f); lineMap.put("label12", 4f); int[] fillColors = {Color.parseColor("#81FFFFFF"), Color.TRANSPARENT}; binding.lineChart.setGradientFillColors(fillColors); binding.lineChart.getAnimation().setDuration(1000); binding.lineChart.animate(lineMap); }

    bug 
    opened by koostamas 12
  • How to Set Horizontal Scroll in Line Chart

    How to Set Horizontal Scroll in Line Chart

    Using Line Chart i enable scroll bar using below code linechart.setHorizontalScrollBarEnabled(true); but i unable to see Scroll in Chart please help me if you have any code or method to set Scroll in Linechart the x axies values are merged not looking good i want to scroll the line chart in horizontal

    duplicate 
    opened by sahilwebmazix 12
  • #253 Allow modification of x and y labels

    #253 Allow modification of x and y labels

    Fixes #253

    The following screenshot shows the change in action for the line chart (note, that the y labels are actually rounded values, I've added this to the demo code as well) and the horizontal bar chart (I've added a random "h" to the end of the label, this is not part of the demo code):

    device-2019-10-21-174956

    opened by ubuntudroid 11
  • Tooltips to StackBarChartView

    Tooltips to StackBarChartView

    Trying to add Tooltips to StackBarChartView like ones in your previous version of example app, marked in blue here : screenshot

    I'm receiveing The specified child already has a parent. You must call removeView() on the child's parent first. in tiers_battles.showTooltip(mTip, false);

    Here is the code:

    private void show_tiers_battles() {
            String[] labels_tiers = getResources().getStringArray(R.array.labels_tiers);
    
            mTip = new Tooltip(getActivity(), R.layout.stackedchart_tooltip, R.id.value);
            mTip.setVerticalAlignment(Tooltip.Alignment.TOP_BOTTOM);
            mTip.setDimensions((int) Tools.fromDpToPx(65), (int) Tools.fromDpToPx(25));
            mTip.setEnterAnimation(PropertyValuesHolder.ofFloat(View.ALPHA, 1), PropertyValuesHolder.ofFloat(View.SCALE_Y, 1f), PropertyValuesHolder.ofFloat(View.SCALE_X, 1f)).setDuration(200);
            mTip.setExitAnimation(PropertyValuesHolder.ofFloat(View.ALPHA, 0), PropertyValuesHolder.ofFloat(View.SCALE_Y, 0f), PropertyValuesHolder.ofFloat(View.SCALE_X, 0f)).setDuration(200);
            mTip.setPivotX(Tools.fromDpToPx(65) / 2);
            mTip.setPivotY(Tools.fromDpToPx(25));
            tiers_battles.setTooltips(mTip);
    
            tiers_battles.setBarSpacing((float) 44.0);
            tiers_battles.setYAxis(false);
            tiers_battles.setYLabels(AxisController.LabelPosition.NONE);
            tiers_battles.setBarBackgroundColor(Color.parseColor("#4D36a19b"));
            tiers_battles.setLabelsColor(Color.parseColor("#ffffff"));
            tiers_battles.setAxisColor(Color.parseColor("#A4A4A4"));
    
            BarSet dataset = new BarSet(labels_tiers, chartsArrays.getTiers_Battles())
                    .setColor(Color.parseColor("#36a19b"));
            tiers_battles.addData(dataset);
    
            Runnable chartOneAction = new Runnable() {
                @Override
                public void run() {
                    ArrayList<Rect> areas = tiers_battles.getEntriesArea(0);
                    for(int i = 0; i < areas.size(); i++) {
                        mTip.prepare(areas.get(i), chartsArrays.getTiers_Battles()[i]);
                        mTip.setEnterAnimation(PropertyValuesHolder.ofFloat(View.ALPHA, 1));
                        mTip.setExitAnimation(PropertyValuesHolder.ofFloat(View.ALPHA, 0));
                        tiers_battles.showTooltip(mTip, false);
                    }
                    run();
                }
            };
    
            Animation anim = new Animation(500)
                    .setEasing(new CubicEase())
                    .setAlpha(1)
                    .setEndAction(chartOneAction);
    
            tiers_battles.show(anim);
        }
    

    What am I doing wrong? Where would you suggest to look at first?

    Thank you

    opened by vanjavanjavanja 11
  • Chart line out of bounds on redraw

    Chart line out of bounds on redraw

    I Want to update chart with new values but update isn't my solution as far as i know because array of labels are changing on every redraw. So i am initializing chart on every call but as show in image below line chart goes of canvas and it doesn't change axis values based on new values: shot-1 shot-2

    public class IncomeLineChart extends ChartBase {
    
    
        private final LineChartView mChart;


        private Tooltip mTip;
        private Context mContext;
        private Runnable mBaseAction;
    
    
        public IncomeLineChart(LineChartView chart, Context context) {
            super();
            mChart = chart;
            mContext = context;
        }
    
    
        @Override
        public void show(Runnable action) {
            // Tooltip
            mTip = new Tooltip(mContext, R.layout.tooltip_income, R.id.value);
            mTip.setVerticalAlignment(Tooltip.Alignment.BOTTOM_TOP);
            mTip.setDimensions((int) Tools.fromDpToPx(58), (int) Tools.fromDpToPx(25));
            mTip.setEnterAnimation(PropertyValuesHolder.ofFloat(View.ALPHA, 1),
                    PropertyValuesHolder.ofFloat(View.SCALE_Y, 1f),
                    PropertyValuesHolder.ofFloat(View.SCALE_X, 1f)).setDuration(200);
            mTip.setExitAnimation(PropertyValuesHolder.ofFloat(View.ALPHA, 0),
                    PropertyValuesHolder.ofFloat(View.SCALE_Y, 0f),
                    PropertyValuesHolder.ofFloat(View.SCALE_X, 0f)).setDuration(200);
            mTip.setPivotX(Tools.fromDpToPx(65) / 2);
            mTip.setPivotY(Tools.fromDpToPx(25));
            mChart.setTooltips(mTip);
    
            LineSet dataSet = new LineSet(mLabels, mValues);
            dataSet.setColor(Color.parseColor("#b3b5bb"))
                    .setFill(Color.parseColor("#2d374c"))
                    .setDotsColor(Color.parseColor("#ffc755"))
                    .setThickness(4);
            mChart.addData(dataSet);
            // Chart
            mChart.setBorderSpacing(Tools.fromDpToPx(15))
                    //.setAxisBorderValues(0, 20)
                    .setYLabels(AxisRenderer.LabelPosition.NONE)
                    .setLabelsColor(Color.parseColor("#6a84c3"))
                    .setXAxis(false)
                    .setYAxis(false);
    
            mBaseAction = action;
            Runnable chartAction = new Runnable() {
                @Override
                public void run() {
                    mBaseAction.run();
                }
            };
            Animation anim = new Animation().setEasing(new BounceInterpolator()).setEndAction(chartAction);
            mChart.show(anim);
        }
    
        @Override
        public void update(String[] labels, float[] values) {
            super.update(labels,values);
            mChart.dismissAllTooltips();
            mChart.updateValues(0, mValues);
            mChart.getChartAnimation().setEndAction(mBaseAction);
            mChart.notifyDataUpdate();
        }
    
    
        @Override
        public void dismiss(Runnable action) {
            super.dismiss(action);
            mChart.dismissAllTooltips();
            mChart.dismiss(new Animation().setEasing(new BounceInterpolator()).setEndAction(action));
        }
    }
    
    opened by ghost 10
  • java.lang.IllegalArgumentException: text cannot be null

    java.lang.IllegalArgumentException: text cannot be null

    Hi.

    some of my app users got this error and I can't reproduce it to solve the problem. can you give me any hint?

    java.lang.IllegalArgumentException: text cannot be null
    	at android.graphics.Paint.measureText(Paint.java:1957)
    	at com.db.chart.view.XController.measureInnerChartRight(SourceFile:109)
    	at com.db.chart.view.XController.measure(SourceFile:46)
    	at com.db.chart.view.ChartView$1.onPreDraw(SourceFile:179)
    	at android.view.ViewTreeObserver.dispatchOnPreDraw(ViewTreeObserver.java:1014)
    	at android.view.ViewRootImpl.performTraversals(ViewRootImpl.java:2510)
    	at android.view.ViewRootImpl.doTraversal(ViewRootImpl.java:1437)
    	at android.view.ViewRootImpl$TraversalRunnable.run(ViewRootImpl.java:7397)
    	at android.view.Choreographer$CallbackRecord.run(Choreographer.java:920)
    	at android.view.Choreographer.doCallbacks(Choreographer.java:695)
    	at android.view.Choreographer.doFrame(Choreographer.java:631)
    	at android.view.Choreographer$FrameDisplayEventReceiver.run(Choreographer.java:906)
    	at android.os.Handler.handleCallback(Handler.java:739)
    	at android.os.Handler.dispatchMessage(Handler.java:95)
    	at android.os.Looper.loop(Looper.java:158)
    	at android.app.ActivityThread.main(ActivityThread.java:7229)
    	at java.lang.reflect.Method.invoke(Native Method)
    	at com.android.internal.os.ZygoteInit$MethodAndArgsCaller.run(ZygoteInit.java:1230)
    	at com.android.internal.os.ZygoteInit.main(ZygoteInit.java:1120)```
    
    opened by hrsalehi 10
  • Cannot build with gradle

    Cannot build with gradle

    I'm using Android Studio 1.1.0. I've been having some issues with building my project with this library. I added my ANDROID_HOME environment variable using the terminal in Android Studio.

    set ANDROID_HOME=C:\...\Android\android-sdk
    

    So using the terminal I navigate to C:...\WilliamChart-master which contains the library source code I downloaded from github (the root directory where the gradlew file is).

    And I managed to do installDebug properly.

    gradlew installDebug
    

    But install doesn't seem to work

    gradlew install
    

    I get the following errors:

    2 errors                                
    58 warnings                             
    :library:androidJavadocs FAILED         
    
    FAILURE: Build failed with an exception.
    
    * What went wrong:
    Execution failed for task ':library:androidJavadocs'.
    > Javadoc generation failed. Generated Javadoc options file (useful for troubleshooting): 'C:\...\WilliamChart-master\library\build\tmp\androidJavadocs\javadoc.options'
    
    * Try:       
    Run with --stacktrace option to get the stack trace. Run with --info or --debug option to get more log output.
    
    BUILD FAILED 
    

    Here's my build.gradle (app)

    dependencies {
        compile fileTree(dir: 'libs', include: ['*.jar'])
        compile 'com.android.support:appcompat-v7:21.0.3'
        compile 'com.doomonafireball.betterpickers:library:1.5.3'
        compile 'com.db.williamchart:library:1.7.0'
    }
    

    Here's my build.gradle (Project)

    buildscript {
        repositories {
            jcenter()
            mavenLocal()
        }
        dependencies {
            classpath 'com.android.tools.build:gradle:1.1.0'
    
        // NOTE: Do not place your application dependencies here; they belong
        // in the individual module build.gradle files
        }
    }
    
    allprojects {
        repositories {
            jcenter()
            mavenLocal()
        }
    }
    
    opened by hyperh 10
  • Center Aligned Graph Draw

    Center Aligned Graph Draw

    How can I set the axis of the graph starting from the center aligned? I would to like draw the graph center horizontally. but its a drawing at the bottom. can you pls solve this issue?

    opened by irshadir7 0
  • Failed to resolve: williamchart:williamchart:unspecified

    Failed to resolve: williamchart:williamchart:unspecified

    I'm getting this despite placing the dependencies correctly in build.gradle

    com.diogobernardino.williamchart:tooltip-slider:3.10.1) com.diogobernardino.williamchart:tooltip-points:3.10.1

    Failed to resolve: williamchart:williamchart:unspecified Show in Project Structure dialog Affected Modules: app

    opened by EzekielWachira 1
  • Function to clear the chart

    Function to clear the chart

    I've to switch between two data sets: a monthly one and a yearly one. How can I "clear" the chart when switching from one data set to the other?

    For now the fix I found is to use chart.barsColorsList = null Any better way to do this?

    Awesome library by the way!

    opened by baudouxbenjamin 0
  • BarChart crashing when changing data on runtime

    BarChart crashing when changing data on runtime

    The BarChart crashes when changing the data on runtime (if the number of datapoints is changed). This is because of the following code: On BarChartView.kt: ` if (barsColorsList == null) barsColorsList = List(frames.size) { barsColor }.toList()

            if (barsColorsList!!.size != frames.size)
                throw IllegalArgumentException("Colors provided do not match the number of datapoints.")`
    

    If someone tries to change the data on runtime, by clicking a filter button for example, the frames.size is changed, but the barsColorsList!!.size isn't, because of the above code only checks for nullability so it doesn't update the barsColorsList.

    Will submit a PR to fix this.

    opened by PavlosTze 1
Releases(3.10.1)
Owner
Diogo Bernardino
Diogo Bernardino
Android library for drawing Pie charts and Donut charts with the ability to customize almost anything in it.

A Pie/Donut*/Ring chart for Android, customizable to the most extent possible. For tutorial and examples refer to the website. build.gradle[.kts] impl

Mahdi Hosseinzadeh 20 Nov 18, 2022
A powerful 🚀 Android chart view / graph view library, supporting line- bar- pie- radar- bubble- and candlestick charts as well as scaling, panning and animations.

⚡ A powerful & easy to use chart library for Android ⚡ Charts is the iOS version of this library Table of Contents Quick Start Gradle Maven Documentat

Philipp Jahoda 36k Dec 31, 2022
AnyChart Android Chart is an amazing data visualization library for easily creating interactive charts in Android apps. It runs on API 19+ (Android 4.4) and features dozens of built-in chart types.

AnyChart for Android AnyChart Android Charts is an amazing data visualization library for easily creating interactive charts in Android apps. It runs

AnyChart 2k Jan 4, 2023
Charts/graphs library for Android compatible with API 8+, several chart types with support for scaling, scrolling and animations

HelloCharts for Android Charting library for Android compatible with API 8+(Android 2.2). Works best when hardware acceleration is available, so API 1

Leszek Wach 7.4k Jan 6, 2023
An android compose library with different Graphs and Charts

plot An android compose library with different Graphs and Charts (currently supports only Line graph, more types will be added soon) Download reposito

Madrapps 106 Dec 30, 2022
An open source library used to draw charts in Android with Jetpack Compose with a simple and easy to use

android-compose-charts This is an open source library used to draw charts in Android with Jetpack Compose with a simple and easy to use. Just couples

Mahmoud Ibrahim 17 Dec 31, 2022
An easy-to-use Android charts library with animation.

AndroidCharts A simple Android charts library. Known Uses in Pomotodo Including in Your Project Eclipse Import /AndroidCharts folder. Move /java folde

HackPlan 1.3k Jan 2, 2023
YBKChart is a library of 3D graphics charts for Android. 📊

YBKChart is a library of 3D graphics charts for Android. ?? For more information, see the Wiki. Chart List Pie Chart Download Use gradle. rep

ByungKwan Yun 10 Jun 19, 2022
Library for charts in android with animations

Charts Gradle Setup Step 1. Add the JitPack repository to your build file Add it in your root build.gradle at the end of repositories: allprojects {

Ayush Saini 4 Dec 30, 2022
Donut is an Android library which helps you to easily create beautiful doughnut-like charts.

Doughnut-like graph view capable of displaying multiple datasets with assignable colors

Futured 509 Jan 3, 2023
Straiberry Charts - An awesome Chart library for android

Straiberry Charts An awesome Chart library for android Straiberry · Report Bug · Request Feature Getting Started Adding dependecies Add it in your roo

StrAIberry 30 Dec 30, 2022
TChart - Simple and fast charts.

TChart - Simple and fast charts.

null 30 Sep 20, 2022
Simple Jetpack Compose Charts for multi-platform. Including Android, Web, Desktop.

compose-charts Simple Jetpack Compose Charts for multi-platform. Including Android, Web, Desktop. Graph Effects How to use? 1, show Pie Chart in Jetpa

Chen Pan 112 Jan 8, 2023
Simple Compose Charts for multi-platform. Including Android, Web, Desktop.

compose-charts-desktop Simple Compose Charts for multi-platform. Including Android, Web, Desktop. Compose multiplatform for Android: compose-charts. G

Chen Pan 13 Dec 30, 2022
Arc Chart View (Draw Creative Statistic Arc Charts)

ArcChartViewDemo You can use this library to draw Arc charts and show your statistics or anything you want or maybe get some ratings from user. you ca

Iman khoshabi 106 Nov 22, 2022
Charting library for Android applications. Automatically exported from code.google.com/p/achartengine

achartengine Charting library for Android applications. Automatically exported from code.google.com/p/achartengine AChartEngine is a charting library

Dan Dromereschi 742 Jan 7, 2023
Android Graph Library for creating zoomable and scrollable line and bar graphs.

Chart and Graph Library for Android Project maintainer wanted! For time reasons I can not continue to maintain GraphView. Contact me if you are intere

Jonas Gehring 2.7k Jan 5, 2023