Android Graph Library for creating zoomable and scrollable line and bar graphs.

Overview

Chart and Graph Library for Android

Project maintainer wanted! For time reasons I can not continue to maintain GraphView. Contact me if you are interested and serious about this project. [email protected]

What is GraphView

GraphView is a library for Android to programmatically create flexible and nice-looking diagrams. It is easy to understand, to integrate and to customize.

Supported graph types:

  • Line Graphs
  • Bar Graphs
  • Point Graphs
  • or implement your own custom types.

Top Features

  • Line Chart, Bar Chart, Points
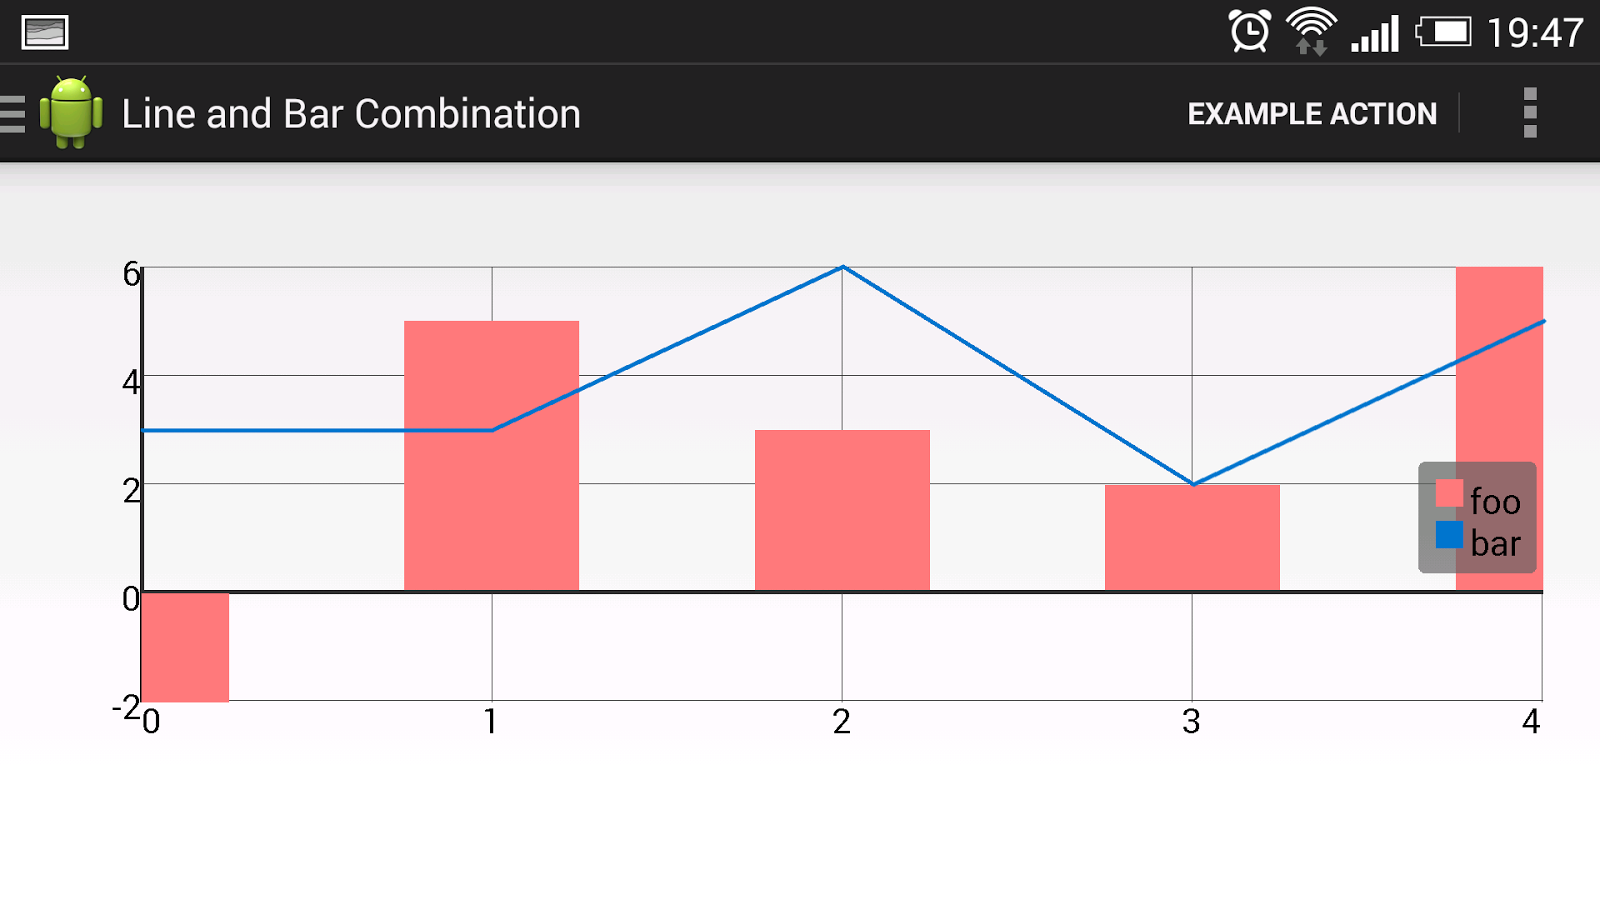
  • Combination of different graph types
  • Scrolling vertical and horizontal . You can scroll with a finger touch move gesture.
  • Scaling / Zooming vertical and horizontal . With two-fingers touch scale gesture (Multi-touch), the viewport can be changed.
  • Realtime Graph (Live change of data)
  • Second scale axis
  • Draw multiple series of data . Let the diagram show more that one series in a graph. You can set a color and a description for every series.
  • Show legend . A legend can be displayed inline the chart. You can set the width and the vertical align (top, middle, bottom).
  • Custom labels . The labels for the x- and y-axis are generated automatically. But you can set your own labels, Strings are possible.
  • Handle incomplete data . It's possible to give the data in different frequency.
  • Viewport . You can limit the viewport so that only a part of the data will be displayed.
  • Manual Y axis limits
  • And much more... Check out the project page and/or the demo app

How to use

  1. Add gradle dependency:
implementation 'com.jjoe64:graphview:4.2.2'
  1. Add view to layout:
<com.jjoe64.graphview.GraphView
        android:layout_width="match_parent"
        android:layout_height="200dip"
        android:id="@+id/graph" />
  1. Add some data:
GraphView graph = (GraphView) findViewById(R.id.graph);
LineGraphSeries<DataPoint> series = new LineGraphSeries<DataPoint>(new DataPoint[] {
          new DataPoint(0, 1),
          new DataPoint(1, 5),
          new DataPoint(2, 3),
          new DataPoint(3, 2),
          new DataPoint(4, 6)
});
graph.addSeries(series);

Download Demo project at Google Play Store


Showcase GraphView Demo App

More examples and documentation

Get started at project wiki homepage

To show you how to integrate the library into an existing project see the GraphView-Demos project! See GraphView-Demos for examples. https://github.com/jjoe64/GraphView-Demos
View GraphView wiki page https://github.com/jjoe64/GraphView/wiki

Comments
  • GraphView on Android Studio

    GraphView on Android Studio

    Hi, I can not load the library on android study also having followed the steps and still get this error: cannot resolve method. Please help me. Import only this "import com.jjoe64.graphview.GraphView;"

    type-support 
    opened by davix10 18
  • GraphView No Horizontal Labels

    GraphView No Horizontal Labels

    Hello- I am new to GitHub, but I am trying to use GraphView 4.0 for an app and for some reason the horizontal labels do not display. Below is the code I am using:

    GraphView graph = (GraphView) chrtView.findViewById(R.id.graph); LineGraphSeries series = new LineGraphSeries(new DataPoint[] { new DataPoint(0, 1), new DataPoint(1, 5), new DataPoint(2, 3), new DataPoint(3, 2), new DataPoint(4, 6) }); graph.addSeries(series);

    And the following XML which is imbedded in a linear layout.

        <com.jjoe64.graphview.GraphView
        android:layout_width="match_parent"
        android:layout_height="200dip"
        android:id="@+id/graph" />
    

    I am not including the .jar file in my library folder but instead include the following statement with my dependencies in my build.gradle:

    compile 'com.jjoe64:graphview:4.0.0'

    This is basically the exact code that included in the documentation. Doe anyone have any suggestions what I might be doing incorrectly?

    thanks.

    prio-high type-bug 
    opened by hydrophylic 17
  • Sample select callback and multi-line X axis labels.

    Sample select callback and multi-line X axis labels.

    Hi Jonas, Thanks for making this nice and intuitive way to quickly draw graphs on Android. I am developing an app which is using GraphView and added some features which were useful for me. My updates are:

    1. Provided a callback mechanism to notify user when a sample point is selected.
    2. X axis labels can now be multi-line (I needed 2 lines). This pull request covers both the above changes. Do review and take in if possible.

    Thanks, Narendra

    prio-low 
    opened by nma83 17
  • added support for missing values and added buffered drawing (great performance improvement)

    added support for missing values and added buffered drawing (great performance improvement)

    Added support for missing values (if Y value is NaN it is not drawn, datapoint between two NaN values are drawn as a dot)

    Added buffered drawing (great performance improvement!)

    ToDo: move the creation of the bitmap/canvas away from the OnDraw event (should only be done at initialisation or orientation change) ToDo: manage scaling when only NaN datapoints are in the series. (skip scaling completely perhaps, or scale to a default range)

    prio-low type-feature 
    opened by mberntsen 14
  • ConcurrentModificationException

    ConcurrentModificationException

    I am using appendData() to create a realtime graph. I call this method during a Bluetooth notification callback which is not running on the main UI thread. This creates a ConcurrentModificationException because the LineGraphSeries is being accessed by my thread to add a new DataPoint, and also an iterator in the onDraw routine of the GraphView. I've been able to work around the problem by pushing my call to appendData() onto the UI thread, but a better solution would be to protect the LineGraphSeries storing the DataPoints inside GraphView using synchronization. This would allow any thread to add data to the graph without pushing the work onto the UI thread. Something like this might work:

    List list = Collections.synchronizedList(new ArrayList(...));

    opened by RobSenix 13
  • Logarithm Scale

    Logarithm Scale

    At the moment graphview doesnt support logarithic scale. However this can be accomplished, by doing the following:

    First let's add some points:(Note all values, must be greater then 0, because of log)

      //Creates an ArrayList
      ArrayList<DataPoint> testList = new ArrayList<>();
    
      //Populates the arrayList whit some values
      float value1 = (float) (Math.log10(1));
      float value2 = (float) (Math.log10(1000));
      float value3 = (float) (Math.log10(30));
      testList.add(new DataPoint(0, value1));
      testList.add(new DataPoint(1,value2));
      testList.add(new DataPoint(2, value3));
      testList.add(new DataPoint(3,value3));
      testList.add(new DataPoint(4, value2));
    
      //Converts ArrayList<DataPoints> to DataPoints[] array
      DataPoint[] test = new DataPoint[testList.size()];
      test = testList.toArray(test);
    
      //Adds the dataPoint array to the graph
      LineGraphSeries<DataPoint> seriesLine = new LineGraphSeries<>(test);
      graphQuality.addSeries(seriesLine);
    

    Second we gonna add our max value, take in notice this use log so, when we set the max value to 1600 doesn't mean the max value will be exactly 1600 but an aproximation to that value.(Complain float numbers not me).

        //Defines graph structure
        graphQuality.getViewport().setYAxisBoundsManual(true);
        graphQuality.getViewport().setMaxY(Math.floor(Math.log10(1600)));
        graphQuality.getViewport().setMinY(0);
    

    Finaly we format the Y value so that now replace the log values by the wanted values:

    graphExample.getLegendRenderer().setVisible(true);
    graphExample.getGridLabelRenderer().setLabelFormatter(new DefaultLabelFormatter() {
    @Override
         public String formatLabel(double value, boolean isValueX) {
             if (isValueX) {
                 return super.formatLabel(value, isValueX);
             } else {
                 String yValue=super.formatLabel(value, isValueX).replaceAll(",",".");
                 Float yLogValue = (float)Math.floor((Math.pow(10, Float.valueOf(yValue))));
                 return (value<=0)? "-∞":String.valueOf(yLogValue);
              }
          }
    });
    
    opened by Yvtq8K3n 12
  • Support for android 4.4, 4.4.2

    Support for android 4.4, 4.4.2

    Hi, I used this awesome library, and it worked for my device, except for my nexus 5 (api 19). I saw in the manifest and the project properties that there is no support for api 19. Can you fix it please? The only problem I noticed is that the graph is not scalable and scrollable.

    Thanks, you do a greate job!

    Golan.

    prio-low type-support 
    opened by Golanhershku 12
  • GraphView must be used in hardware accelerated mode

    GraphView must be used in hardware accelerated mode

    when i try to take a snapshot of my screen in which GraphView has been used, it throws me an error. "GraphView must be used in hardware accelerated mode" Even though i make it hardware "acceleration =true" on the required Activity and even on Application still the problem persists. I am using version Graphview 4.1.0

    prio-high 
    opened by BplAndroid 11
  • Import with Eclipse failed: Plugin with id 'android-library' not found

    Import with Eclipse failed: Plugin with id 'android-library' not found

    I'm new to Gradle so please excuse me, if this is just a noob asking sth. obvious:

    Since we still use Eclipse for our day-to-day Android programming, we need to somehow import your lib with the Eclipse Gradle Plugin (by the Spring guys). Uppon clicking the "Build Model" button on Gradles import wizard, the error from the title occurs.

    Can you give me some advice, how to solve this without a necessity of installing Android Studio? And please not just by "Install Android Studio"...

    Thank you in advance, Daniel

    opened by bgmf 9
  • BarGraphView

    BarGraphView

    Hello. I have some issues with BarGraphView; (vertical lines count and barwidth)

    There are quick fixes:

    //BarGraphView.java //float colwidth = (graphwidth - (2 * border)) / values.length; float colwidth = graphwidth / values.length;

    //GraphView.java // horizontal labels + lines int hors = horlabels.length; for (int i = 0; i <= horlabels.length; i++) { paint.setColor(Color.DKGRAY); float x = ((graphwidth / hors) * i) + horstart; canvas.drawLine(x, height - border, x, border, paint); paint.setTextAlign(Align.CENTER); if (i < horlabels.length) { paint.setColor(Color.WHITE); canvas.drawText(horlabels[i], x + (graphwidth / hors) / 2, height - 4, paint); } }

    prio-high type-support type-bug 
    opened by lexius 9
  • Unexpected freeze with real time updates

    Unexpected freeze with real time updates

    My app requires drawing graph from real time data. I have thread with all the communication that is providing the data. In main thread I am reading this data and simply use mSeries1.appendData(new DataPoint(counter,data[0]),true,100); where counter is int that is incremented after each update.

    Unfortunately at some point it freeze. I've tried putting it in synchronized block or changing the line of code to mSeries1.appendData(new DataPoint(counter,counter),true,100); and still this same result.

    This is how the memory looks like during app running and when it freezes: memory

    Is that some library error or there is something wrong in my code?

    prio-low type-documentation 
    opened by s-peryt 8
  • Title of second scale is not displaying.

    Title of second scale is not displaying.

    Hello everyone! Unfortunately, method 'drawVerticalAxisTitle' in class 'SecondScale' has protected modifaction. I tryed to make inhereter of class SecondScale for calling this method, but constructor of class 'SecondScale' has private modification. How can I display the title for the second y-axis? Help me, please.

    opened by Fortrend96 0
  • Does Real Time/Live Data need to be like the example?

    Does Real Time/Live Data need to be like the example?

    https://github.com/jjoe64/GraphView/wiki/Realtime-chart What if i create threads or handler? or service listener register interface etc? like got services that when they get data they send instantly and these i use to update the graphs etc.

    In the past i used threads and handlers and it laged like hell then i used your example in link and it was fine and also its fine with the last way i described. Any ideas why so much lag? i though becase in library when iappend data it uses ArrayList but now it is fine i just dont know why it lags so much and now not.

    opened by PanagiotisJunMobileDev 0
  • Realtime

    Realtime

    Hi & thanks for your useful library

    I cant understand how to draw real-time graph. I read the related page but I don't know where to use those codes. Are they written in a new java class or added to my own activity class?

    New to android, sorry for beginner question.

    opened by smmss79 0
  • App Crash

    App Crash

    Hello everyone,

    I am using this library for plotting real-time coming data. I clean the graph each 2000 samples reiceved in order to not stress the visualization capability. I also activate Log.v in some parts of my code. At some point in a randomly way I got this error from my Log:

    V/Plot 1: OK V/Plot 3: OK V/Plot 2: OK V/Plot 1: OK V/Plot 3: OK V/Plot 2: OK D/AndroidRuntime: Shutting down VM E/AndroidRuntime: FATAL EXCEPTION: main Process: com.example.myapplication.exo_app, PID: 2918 java.lang.NullPointerException: Attempt to invoke interface method 'double com.jjoe64.graphview.series.DataPointInterface.getX()' on a null object reference at com.jjoe64.graphview.series.BaseSeries.getLowestValueX(BaseSeries.java:125) at com.jjoe64.graphview.Viewport.calcCompleteRange(Viewport.java:741) at com.jjoe64.graphview.GraphView.onDataChanged(GraphView.java:283) at com.jjoe64.graphview.Viewport.scrollToEnd(Viewport.java:1180) at com.jjoe64.graphview.series.BaseSeries.appendData(BaseSeries.java:484) at com.jjoe64.graphview.series.LineGraphSeries.appendData(LineGraphSeries.java:677) at com.jjoe64.graphview.series.BaseSeries.appendData(BaseSeries.java:502) at com.example.myapplication.exo_app.MainActivity$Thread2$1.run(MainActivity.java:418) at android.os.Handler.handleCallback(Handler.java:883) at android.os.Handler.dispatchMessage(Handler.java:100) at android.os.Looper.loop(Looper.java:224) at android.app.ActivityThread.main(ActivityThread.java:7560) at java.lang.reflect.Method.invoke(Native Method) at com.android.internal.os.RuntimeInit$MethodAndArgsCaller.run(RuntimeInit.java:539) at com.android.internal.os.ZygoteInit.main(ZygoteInit.java:950) I/Process: Sending signal. PID: 2918 SIG: 9

    Based in my code in MainActivity.java:

    if (data[7]%plot_freq==0) { series.appendData(new DataPoint(x, pitch_1),true,500); Log.v("Plot 1","OK"); } if (data_2[7]%plot_freq==0) { series_2.appendData(new DataPoint(x, pitch_2),true,500); Log.v("Plot 2","OK"); } if (data_3[7]%plot_freq==0) { series_3.appendData(new DataPoint(x, pitch_3),true,500); Log.v("Plot 3","OK"); }

    It means that I got error before appending 3rd series. Has anyone has an idea?

    Thanks,

    opened by valerio-arcobelli 0
  • GraphView not getting any Data, Lines etc.

    GraphView not getting any Data, Lines etc.

    Hey guys, i am really new in this and I have to make an app for a project in my school.. the thing is I am trying to put some Data in the GraphView but it´s not showing anything in the app.. I see the GraphView with default values only and my values don´t get shown in there.. i am using the bottom navigation tab and GraphView is in the home_fragment..so i made a public class (own file) under .ui.home and wrote this code : ` public class GraphActivity extends FragmentActivity {

    @Override
    protected void onCreate(Bundle savedInstanceState) {
        super.onCreate(savedInstanceState);
        setContentView(R.layout.fragment_dashboard);
    
        GraphView graph = (GraphView) findViewById(R.id.graph);
    
        LineGraphSeries<DataPoint> series = new LineGraphSeries<>(new DataPoint[]{
                new DataPoint(0, 1),
                new DataPoint(1, 5),
                new DataPoint(2, 3),
                new DataPoint(3, 2),
                new DataPoint(4, 6)});
        graph.addSeries(series);
    
    }
    

    } ` i´m not getting any errors just the data is not being shown... thanks in advance

    opened by mglbvc8 0
  • GridLabelRenderer humanRound causes data to be hidden

    GridLabelRenderer humanRound causes data to be hidden

    In GridLabelRenderer.adjustHorizontal the call to humanRound is hardwired to false for the second argument. This means that the increments between labels will always round down. That leads to data being truncated from the graph.

    An easy way to see this is a one-line modification of the all-XML example given here. Replace the last line of

        <com.jjoe64.graphview.helper.GraphViewXML
            android:layout_width="match_parent"
            android:layout_height="100dip"
            app:seriesData="0=5;2=5;3=0;4=2" />
    

    with

            app:seriesData="100=5;150=5;200=0;250=2" />
    

    and you will see that the data, which runs from 100 to 250, is truncated at 180, hiding two of the four points. GraphTruncated

    There are several ways to address this I suppose, including

    • Just hardwire the value to true. This may waste a little screen space, but should not hide data.
    • Make the value user-configurable.
    • Adjust both the step size and number of labels for a possibly better compromise.
    opened by VeloSteve 0
Releases(v3.1)
Owner
Jonas Gehring
Mobile App Developer
Jonas Gehring
A powerful 🚀 Android chart view / graph view library, supporting line- bar- pie- radar- bubble- and candlestick charts as well as scaling, panning and animations.

⚡ A powerful & easy to use chart library for Android ⚡ Charts is the iOS version of this library Table of Contents Quick Start Gradle Maven Documentat

Philipp Jahoda 36k Dec 31, 2022
Open-source native Android graph/chart framework includes line chart,stick chart,candlestick chart,pie chart,spider-web chart etc.

Welcome to Android-Charts Welcome to Android-Charts project page on github.com. We just moved from Google Code. Android-Charts is an open-source andro

limc.cn 813 Dec 20, 2022
Android Tableau library supports variety of graphs which developers simply integrate visualization reports on Android application.

Android Tableau Library Android Tableau library supports variety of graphs which developers simply integrate visualization reports on Android applicat

Sung Hyun 54 Jan 1, 2023
Charts/graphs library for Android compatible with API 8+, several chart types with support for scaling, scrolling and animations

HelloCharts for Android Charting library for Android compatible with API 8+(Android 2.2). Works best when hardware acceleration is available, so API 1

Leszek Wach 7.4k Jan 6, 2023
An android compose library with different Graphs and Charts

plot An android compose library with different Graphs and Charts (currently supports only Line graph, more types will be added soon) Download reposito

Madrapps 106 Dec 30, 2022
Simple Line, Circle, Bar chart for Android

SimpleChart Simple Line, Circle, Bar chart for Android LineChart <com.aghajari.simplechart.LineChart android:id="@+id/line_chart" android:layo

AmirHosseinAghajari 5 Jul 28, 2022
An Android chart and graph library

EazeGraph EazeGraph is an Android library for creating beautiful and fancy charts. Its main goal was to create a lighweight library which is easy to u

Paul Cech 1.6k Dec 23, 2022
✨ A very Minimal, Sleek and Powerful Graph library for Android using Jetpack Compose

Composable-Graphs ( Jetpack Compose ) ✨ A very Minimal, Sleek and Lightweight Graph library for Android using Jetpack Compose Gradle Setup allprojects

Jai Keerthick 18 Dec 29, 2022
AnyChart Android Chart is an amazing data visualization library for easily creating interactive charts in Android apps. It runs on API 19+ (Android 4.4) and features dozens of built-in chart types.

AnyChart for Android AnyChart Android Charts is an amazing data visualization library for easily creating interactive charts in Android apps. It runs

AnyChart 2k Jan 4, 2023
A powerful 🚀 Android range bar chart library as well as scaling, panning and animations.

RangeBarChart ⚡ Range bar chart library for Android using MPAndroidChart ⚡ There were no charts in MPAndroidChart to show ranges. We were forced to sh

Ted Park 8 Nov 24, 2022
BubbleTabBar is bottom navigation bar with customizable bubble like tabs

BubbleTabBar BubbleTabBar is bottom navigation bar with customizable bubble like tabs Download AIX : Download Aix License Licensed under the Apache Li

Zain Ul Hassan 7 Dec 3, 2022
PopupBarChart 📊 can shows a tooltip when user click on the bar 😍 🤩

PopupBarChart ?? can shows a tooltip when user click on the bar ?? ??

Justin George 38 Oct 15, 2022
Android Library to rapidly develop attractive and insightful charts in android applications.

williamchart Williamchart is an Android Library to rapidly implement attractive and insightful charts in android applications. Note: WilliamChart v3 h

Diogo Bernardino 4.9k Dec 30, 2022
Android Library to rapidly develop attractive and insightful charts in android applications.

williamchart Williamchart is an Android Library to rapidly implement attractive and insightful charts in android applications. Note: WilliamChart v3 h

Diogo Bernardino 4.8k Dec 22, 2021
Android library for drawing Pie charts and Donut charts with the ability to customize almost anything in it.

A Pie/Donut*/Ring chart for Android, customizable to the most extent possible. For tutorial and examples refer to the website. build.gradle[.kts] impl

Mahdi Hosseinzadeh 20 Nov 18, 2022
An open source library used to draw charts in Android with Jetpack Compose with a simple and easy to use

android-compose-charts This is an open source library used to draw charts in Android with Jetpack Compose with a simple and easy to use. Just couples

Mahmoud Ibrahim 17 Dec 31, 2022
Charting library for Android applications. Automatically exported from code.google.com/p/achartengine

achartengine Charting library for Android applications. Automatically exported from code.google.com/p/achartengine AChartEngine is a charting library

Dan Dromereschi 742 Jan 7, 2023
An easy-to-use Android charts library with animation.

AndroidCharts A simple Android charts library. Known Uses in Pomotodo Including in Your Project Eclipse Import /AndroidCharts folder. Move /java folde

HackPlan 1.3k Jan 2, 2023