EazeGraph
EazeGraph is an Android library for creating beautiful and fancy charts. Its main goal was to create a lighweight library which is easy to use and highly customizeable with an "up-to-date"-look.
Currently 4 different chart types are available, which can be viewed below.
IMPORTANT:
This library is not intented for "mathematical" purposes like "achartengine" or "androidplot". It is intented to have a beautiful visual presentation of "user related"-data where only one value is provided and the rest is calculated dynamically.
So for example it's not possible to push 2D-values in the LineChart and let them plot just like in our beloved math lessons.
If you want such functionality either you use one of the libraries I named before or you wait some time until I finished a "mathematical plotting"-chart ;)
Currently BarCharts only support positive values. I will provide this functionality later.
Your Android application should use Android API Level 9 or higher in order to use this library!!!
Chart types
- Bar Chart
- Stacked Bar Chart
- Pie Chart
- Line Chart
Features
- 4 different chart types
- dynamic legend label generation
- possibility to use your own legend labels
- animations for every chart
- touch interaction for PieChart and LineChart
- various xml attributes for customizing the charts
- and much more
Examples
Examples on how to correctly use these charts are either below or you can view the source of the sample app I provided.
If you want to see the library in action, just download the sample app from the PlayStore: https://play.google.com/store/apps/details?id=org.eazegraph.app
Including in your project
Add in your android app project folder in the 'build.gradle' under dependencies:
dependencies {
    compile 'com.github.blackfizz:eazegraph:1.2.2@aar'
    compile 'com.nineoldandroids:library:2.4.0'
}
Or if you want to use my new lightweight library without any interaction some new features then download this:
dependencies {
    compile 'com.github.blackfizz:eazegraph:1.2.5l@aar'
    compile 'com.nineoldandroids:library:2.4.0'
}
The library uses the nineoldandroids support library to support the animations on older devices. If you already use this library, you don't have to include it. That's it. now you are ready to use the library!
Usage
Project setup
Before you use the project please prepare all required settings in a configuration file. There is an example file called gradle.properties.example contained in the repository which you can copy and rename to gradle.properties.
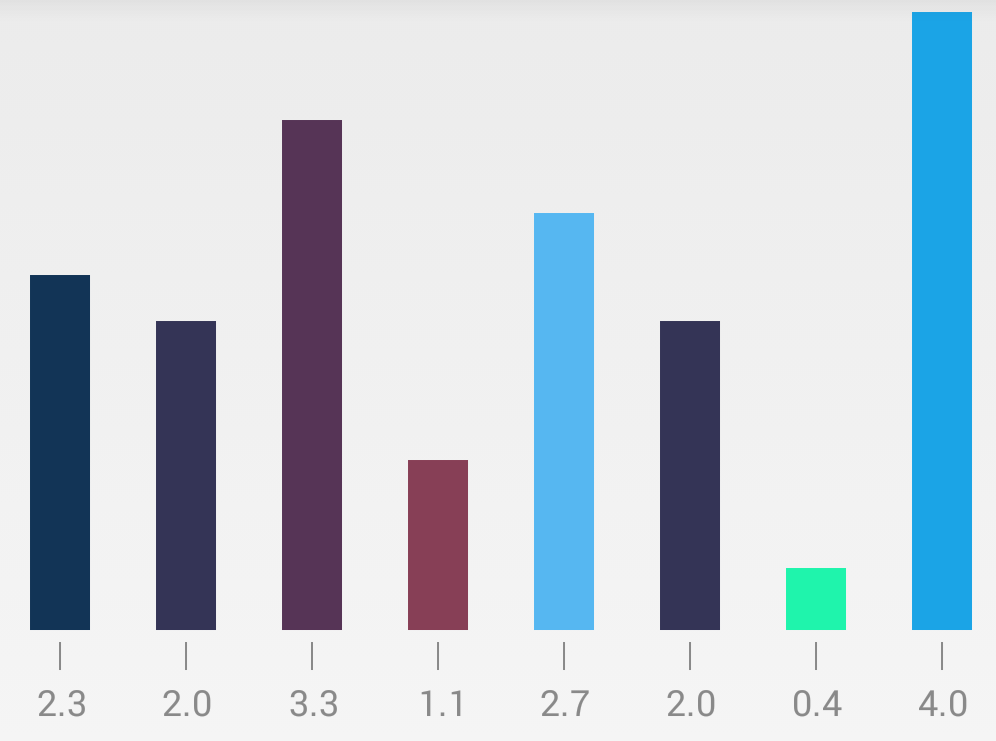
Bar Chart
XML
<org.eazegraph.lib.charts.BarChart
    xmlns:app="http://schemas.android.com/apk/res-auto"
    android:id="@+id/barchart"
    android:layout_width="match_parent"
    android:layout_height="256dp"
    android:padding="10dp"
    app:egFixedBarWidth="true"
    app:egBarWidth="20dp"
    app:egLegendHeight="40dp"/>
Java
BarChart mBarChart = (BarChart) findViewById(R.id.barchart);

mBarChart.addBar(new BarModel(2.3f, 0xFF123456));
mBarChart.addBar(new BarModel(2.f,  0xFF343456));
mBarChart.addBar(new BarModel(3.3f, 0xFF563456));
mBarChart.addBar(new BarModel(1.1f, 0xFF873F56));
mBarChart.addBar(new BarModel(2.7f, 0xFF56B7F1));
mBarChart.addBar(new BarModel(2.f,  0xFF343456));
mBarChart.addBar(new BarModel(0.4f, 0xFF1FF4AC));
mBarChart.addBar(new BarModel(4.f,  0xFF1BA4E6));

mBarChart.startAnimation();
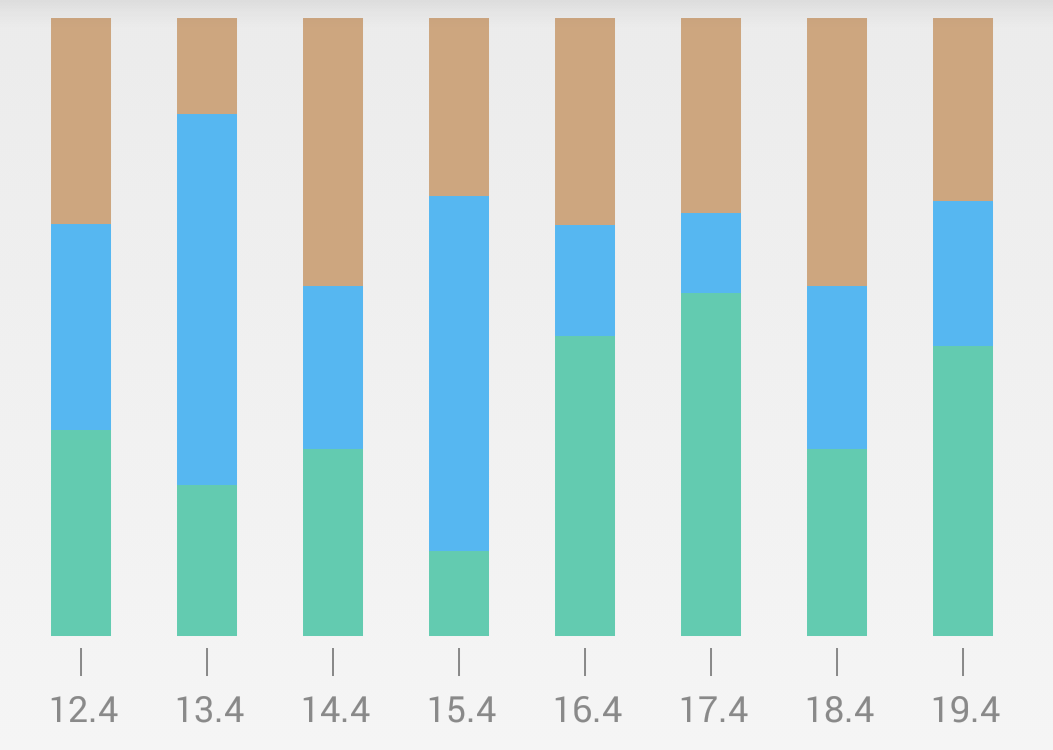
Stacked Bar Chart
XML
<org.eazegraph.lib.charts.StackedBarChart
    xmlns:app="http://schemas.android.com/apk/res-auto"
    android:id="@+id/stackedbarchart"
    android:layout_width="match_parent"
    android:layout_height="256dp"
    android:padding="10dp"
    app:egFixedBarWidth="true"
    app:egBarWidth="20dp"
    app:egLegendHeight="40dp"/>
Java
StackedBarChart mStackedBarChart = (StackedBarChart) findViewById(R.id.stackedbarchart);

StackedBarModel s1 = new StackedBarModel("12.4");

s1.addBar(new BarModel(2.3f, 0xFF63CBB0));
s1.addBar(new BarModel(2.3f, 0xFF56B7F1));
s1.addBar(new BarModel(2.3f, 0xFFCDA67F));

StackedBarModel s2 = new StackedBarModel("13.4");
s2.addBar(new BarModel(1.1f, 0xFF63CBB0));
s2.addBar(new BarModel(2.7f, 0xFF56B7F1));
s2.addBar(new BarModel(0.7f, 0xFFCDA67F));

StackedBarModel s3 = new StackedBarModel("14.4");

s3.addBar(new BarModel(2.3f, 0xFF63CBB0));
s3.addBar(new BarModel(2.f, 0xFF56B7F1));
s3.addBar(new BarModel(3.3f, 0xFFCDA67F));

StackedBarModel s4 = new StackedBarModel("15.4");
s4.addBar(new BarModel(1.f, 0xFF63CBB0));
s4.addBar(new BarModel(4.2f, 0xFF56B7F1));
s4.addBar(new BarModel(2.1f, 0xFFCDA67F));

mStackedBarChart.addBar(s1);
mStackedBarChart.addBar(s2);
mStackedBarChart.addBar(s3);
mStackedBarChart.addBar(s4);

mStackedBarChart.startAnimation();
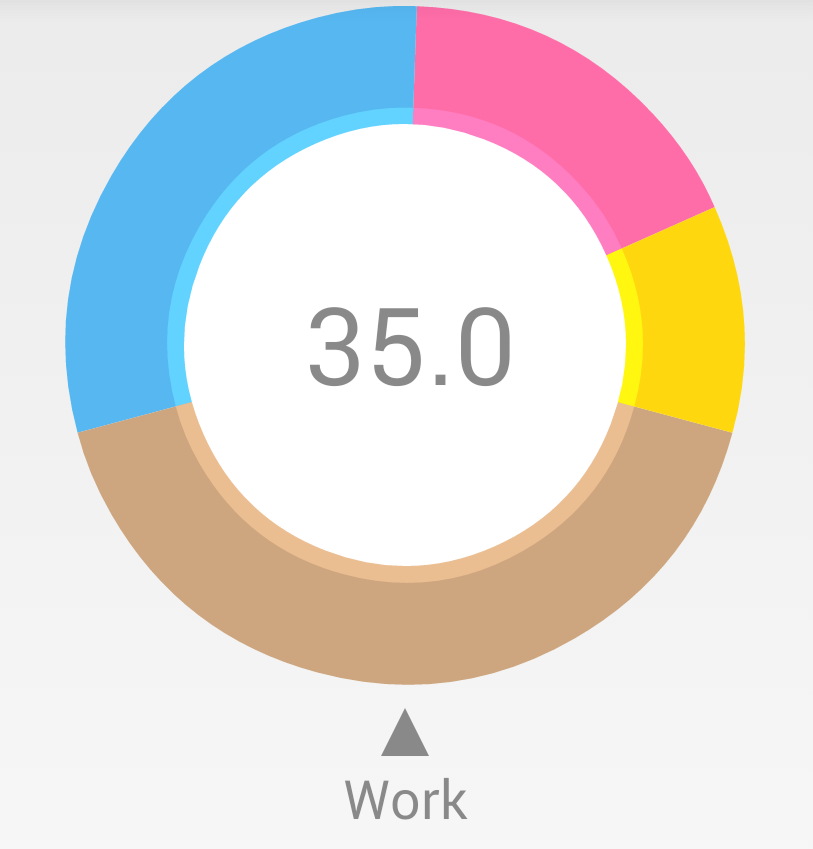
PieChart
XML
 <org.eazegraph.lib.charts.PieChart
    xmlns:app="http://schemas.android.com/apk/res-auto"
    android:id="@+id/piechart"
    android:layout_width="match_parent"
    android:layout_height="300dp"
    android:padding="8dp"
    app:egLegendTextSize="18sp"
    app:egUsePieRotation="true"
    app:egValueTextSize="36sp"/>
Java
PieChart mPieChart = (PieChart) findViewById(R.id.piechart);

mPieChart.addPieSlice(new PieModel("Freetime", 15, Color.parseColor("#FE6DA8")));
mPieChart.addPieSlice(new PieModel("Sleep", 25, Color.parseColor("#56B7F1")));
mPieChart.addPieSlice(new PieModel("Work", 35, Color.parseColor("#CDA67F")));
mPieChart.addPieSlice(new PieModel("Eating", 9, Color.parseColor("#FED70E")));

mPieChart.startAnimation();
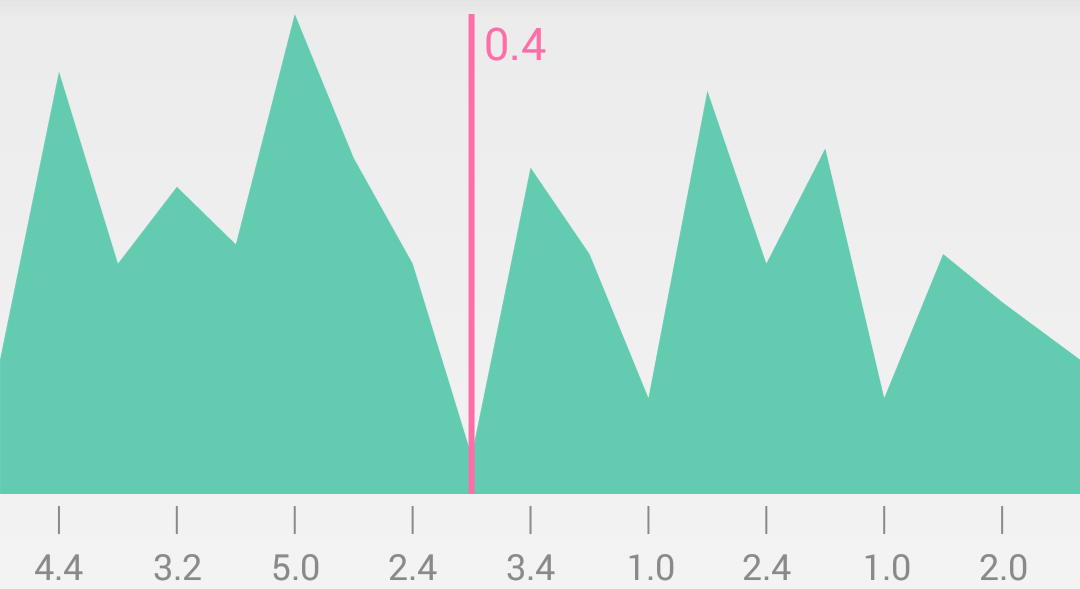
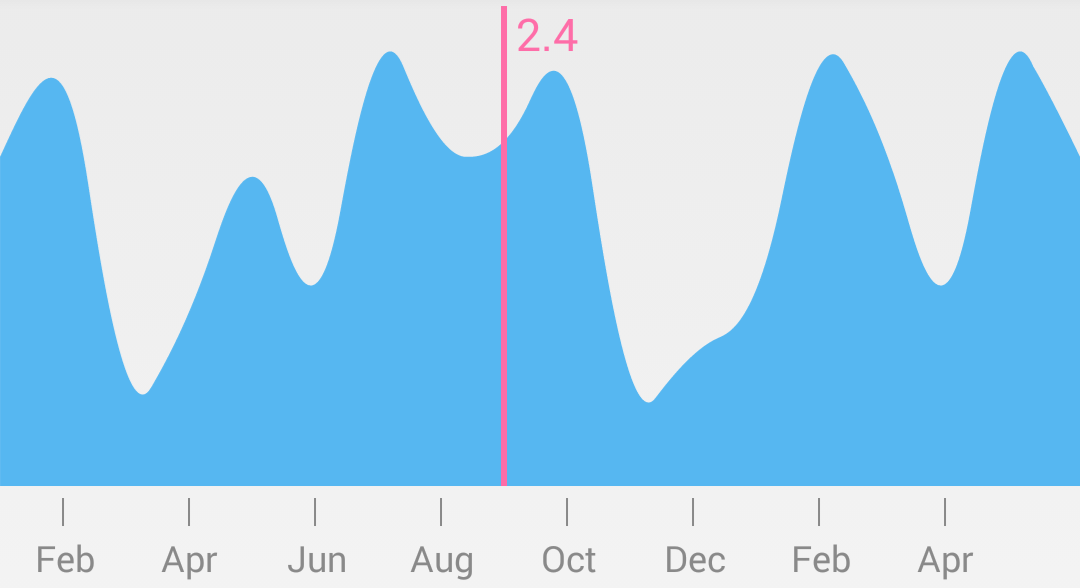
Line Chart
XML
<org.eazegraph.lib.charts.ValueLineChart
    xmlns:app="http://schemas.android.com/apk/res-auto"
    android:id="@+id/cubiclinechart"
    android:layout_width="match_parent"
    android:layout_height="200dp"
    app:egUseCubic="true"
    app:egUseOverlapFill="true"
    app:egCurveSmoothness="0.4"
    app:egIndicatorLineColor="#FE6DA8"
    app:egLegendHeight="40dp"
    app:egShowStandardValue="true"/>
Java
ValueLineChart mCubicValueLineChart = (ValueLineChart) findViewById(R.id.cubiclinechart);

ValueLineSeries series = new ValueLineSeries();
series.setColor(0xFF56B7F1);

series.addPoint(new ValueLinePoint("Jan", 2.4f));
series.addPoint(new ValueLinePoint("Feb", 3.4f));
series.addPoint(new ValueLinePoint("Mar", .4f));
series.addPoint(new ValueLinePoint("Apr", 1.2f));
series.addPoint(new ValueLinePoint("Mai", 2.6f));
series.addPoint(new ValueLinePoint("Jun", 1.0f));
series.addPoint(new ValueLinePoint("Jul", 3.5f));
series.addPoint(new ValueLinePoint("Aug", 2.4f));
series.addPoint(new ValueLinePoint("Sep", 2.4f));
series.addPoint(new ValueLinePoint("Oct", 3.4f));
series.addPoint(new ValueLinePoint("Nov", .4f));
series.addPoint(new ValueLinePoint("Dec", 1.3f));

mCubicValueLineChart.addSeries(series);
mCubicValueLineChart.startAnimation();
Wiki
Changelog
1.2.2
- Made some little additions to vertical barchart
1.2.1
- Added support for vertical barchart
1.2.0
- Fixed many bugs and added zooming for LineCharts and scrolling for BarCharts if there are many values.
I had those things on my HDD for some months and never had the time to release it or to polish it. I think this should be stable and release it for you guys. I know there are some open issues and I really want to fix those error or implement new features, but I am not able to do anything of those as I am completely busy with my university and work. In addition to that I made a lightweight variant of the library for my work which can be downloaded as the version 1.2.5l. This removes every physical interaction with the library and only provides displaying functionality. Most of the work went into the ValueLineChart as it now has a X-Grid with 4 stages. I don't know when I have some time again to implement new stuff or fix bugs, but i hope it won't be so long as my last absence. Happy using :)
1.1.14
- added missing getter and setter for new attributes
1.1.13
- fixed issue #24
1.1.12
- added dynamic scaling for ValueLineChart with the attribute
egUseDynamicScalingand the scaling factor can be set withegScalingFactorwhich should be between 0 and 1 (When only high values are given, the chart scales them down to achieve a better presentation without any loss of information) - added Scrolling in BarCharts
- PieCharts animations are now running properly on Android 2.3 devices (Autocenter and scrolling)
1.1.10
- removed the
egStandardValueIndicatorStrokeandegStandardValueColorattributes and created an extraStandardValueclass, which contains all these information. Doing this enabled the support for multiple StandardValues - fixed issue #23
- fixed bug in ValueLineChart when inserting an empty series, the previous indicator is still shown even when there is no data available.
- fixed bug in PieChart when an InnerPadding is activated, the animated inner circle sometimes is a little smaller than the PieChart which led to colored edges.
- tweaked the legend generation algorithm
- added Comparable interface for
BarModel,PieModel,ValueLinePoint
1.1.9
- did a complete code restructuring. Now adding the graph, graph overlay and legend view is done by the
BaseChartclass and only calls methods which can be overwritten in the child graph classes. This reduced many redundancies and the layout generation of the views is handled in one location. - based on the restructuring, the padding attributes are now drawn and interpreted correctly and no chart has to include the padding in the calculation as it is handled in the layout generation.
1.1.8
- fixed bug in VlaueLineChart where the
egActivateIndicatorShadowwas not usable - added the possibility to change colors for the legend
- added a toggle which activates the drawing of the currently selected ValueLineChart point beneath the indicator (
egActivateIndicatorShadow)
1.1.7
- PieChart's inner value and ValueLineChart's indicator value now can be extended with an unit. (PieChart:
egInnerValueUnitValueLineChart:egIndicatorTextUnit) - (ValueLineChart) removed
egIndicatorColorand made separate attributes for indicator line and text (egIndicatorLineColorandegIndicatorTextColor) - (ValueLineChart) the indicator now support a shadow layer (
egActivateIndicatorShadow,egIndicatorShadowStrength,egIndicatorShadowColor)
1.1.6
- made egShowDecimal attribute available for every chart
1.1.4
- Values in bar chart are now always above the bar
- Added InnerPaddingColor attribute
1.1.3
- fixed onCLick Listener for BarChart
1.1.2
- Added "showValues" for BarChart
- fixed issue #2 and made BarCharts clickable
- little adjustments and fixes
1.1.1
- documented complete sourcecode
- refactored the code and fixed some minor bugs
1.1.0
- added support for Android API Level 9 and higher (added nineoldandroids library to support animations on older devices)
1.0.14
- fixed Issue #7
- fixed bug in ValueLineChart (NegativeOffset wasn't updated)
1.0.10
- fixed bug in PieChart's current item calculation and autocenter
1.0.9
- fixed bug in BarCharts, when layout size changed and the chart tried to calculate positions for empty elements.
1.0.8
- LineChart's value will now set its position the the left of the indicator, if it doesn't fit on the screen
- fixed bug where the LineChart GraphOverlay wasn't updated when new values are imported
1.0.7
- the opening animation can now be opened clockwise or counterclockwise (use attribute "egOpenClockwise"
1.0.6
- added possibility to use a custom set inner value in PieChart
1.0.5
- added x-axis for Line Charts
- Line Charts now support negative values
1.0.4
- added standard value for line chart and the corresponding XML-attributes
- fixed some calculation bugs which caused some displaying errors when a lot of data is inserted
- added clearing methods for Charts
- fixed the legend calculation function
1.0.1
- added 'eg' namespace for attributes
1.0.0
- initial commit of this library
Contributing
I would love to see people contributing to this project. So just go ahead. If you think you did something amazing and your feature should be implemented in this library, make a pull request! Do not hesitate.
Reference
Apps using EazeGraph:
https://play.google.com/store/apps/details?id=com.yazio.android
License
Copyright (C) 2015 Paul Cech

Licensed under the Apache License, Version 2.0 (the "License");
you may not use this file except in compliance with the License.
You may obtain a copy of the License at

http://www.apache.org/licenses/LICENSE-2.0

Unless required by applicable law or agreed to in writing, software
distributed under the License is distributed on an "AS IS" BASIS,
WITHOUT WARRANTIES OR CONDITIONS OF ANY KIND, either express or implied.
See the License for the specific language governing permissions and
limitations under the License.


 From the picture above, we can tell that the Y values are 0, 1, 3, 5, instead of 0, 2, 4, 6. And the highest point of the red curve is a little bit lower than expected(the actual value is 7.5).


 2k Jan 4, 2023
 36k Dec 31, 2022
 1.6k Dec 23, 2022
 8 Jan 4, 2023
 7.4k Jan 6, 2023
 8 Nov 24, 2022
 2.7k Jan 5, 2023
 30 Dec 30, 2022
 491 Jan 9, 2023
 18 Dec 29, 2022
 2 Dec 21, 2022
 5 Jul 28, 2022
 1 Jan 13, 2022
 106 Nov 22, 2022
 4.9k Dec 30, 2022
 106 Dec 30, 2022
 20 Nov 18, 2022