A Powerful Android Charting Library by https://www.numetriclabz.com/

Overview

numAndroidCharts

A Powerful Android Charting Library by Numetric Technologies

Features

Core features:

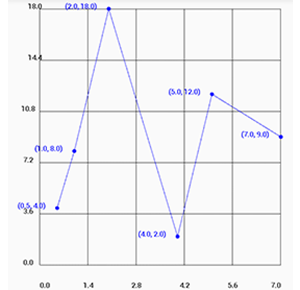
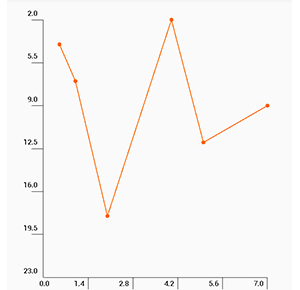
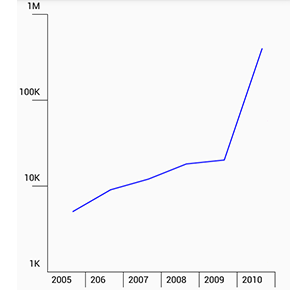
  • [Line Chart](#Line Chart)
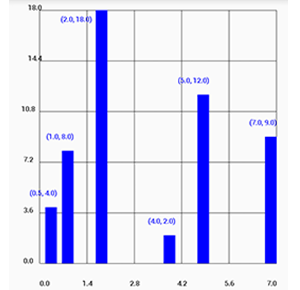
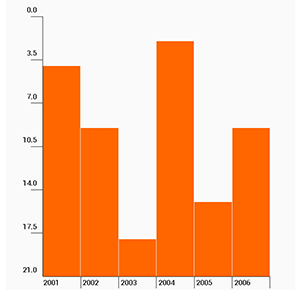
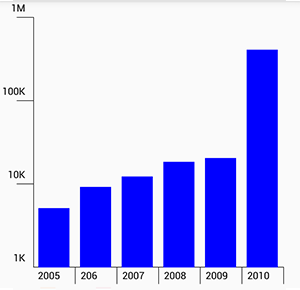
  • [Bar Chart](#Bar Chart)
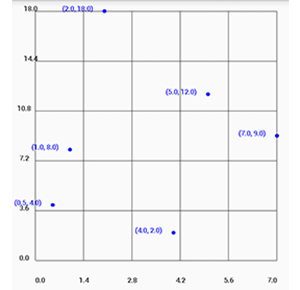
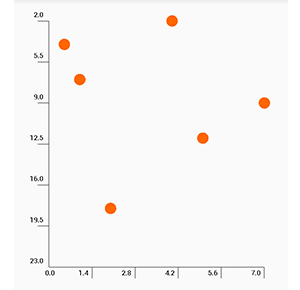
  • [Scatter Chart](#Scatter Chart)
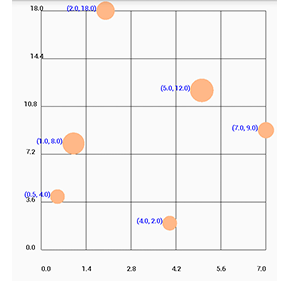
  • [Bubble Chart](#Bubble Chart)
  • [Pie Chart](#Pie Chart)
  • [Donut Chart](#Donut Chart)
  • [Radar Chart](#Radar Chart)
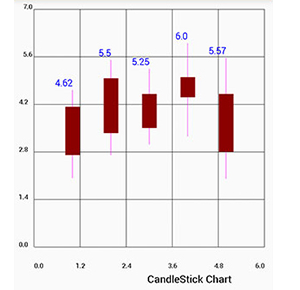
  • [Candle Stick Chart](#Candle Stick Chart)
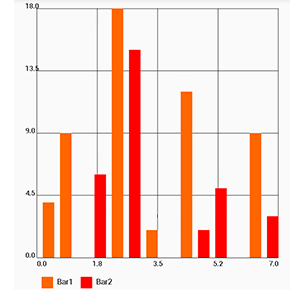
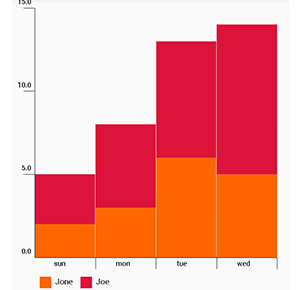
  • [Grouped Bar Chart](#Grouped Bar Chart)
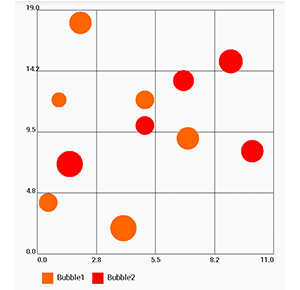
  • [Multi-Series Bubble Chart](#Multi-Series Bubble Chart)
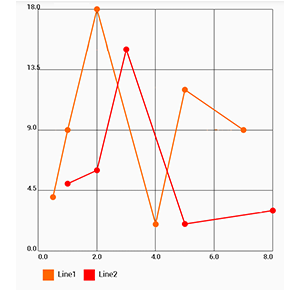
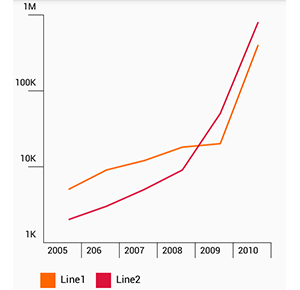
  • [Multi-Series Line Chart](#Multi-Series Line Chart)
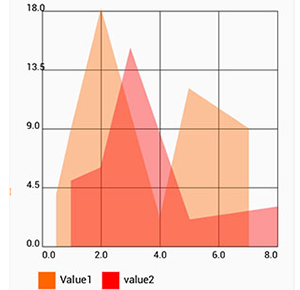
  • [Area Chart](#Area Chart)
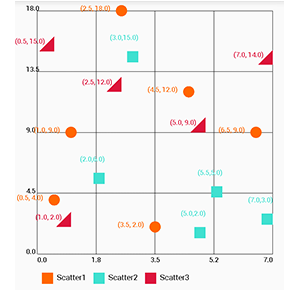
  • [Multi-Series Scatter Chart](#Multi-Series Scatter Chart)
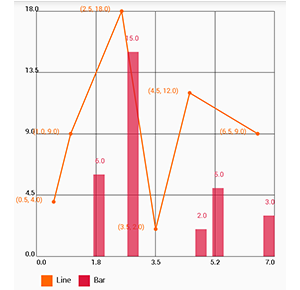
  • [Combined Line and Bar Chart](#Combined Line and Bar Chart)
  • [Semi Circle Pie Chart](#Semi Circle Pie Chart)
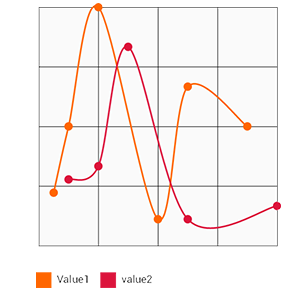
  • [Multi-Series Spline Chart](#Multi-Series Spline Chart)
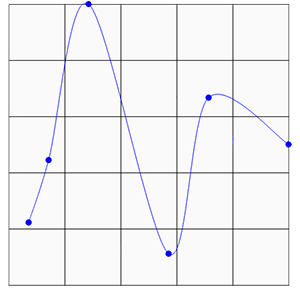
  • [Spline Chart](#Spline Chart)
  • [Horizontal Bar Chart](#Horizontal Bar Chart)
  • [Pyramid Chart](#Pyramid Chart)
  • [Funnel Chart](#Funnel Chart)
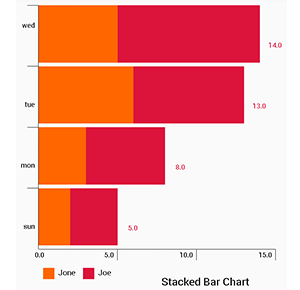
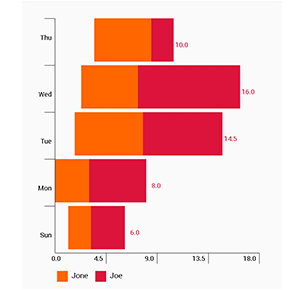
  • [Stacked Bar Chart](#Stacked Bar Chart)
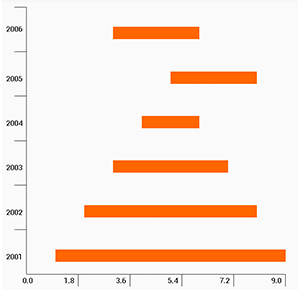
  • [Column Range Chart](#Column Range Chart)
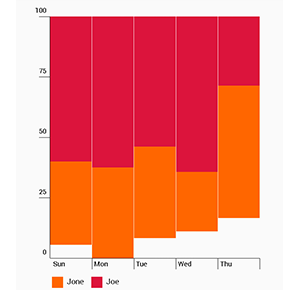
  • [Stacked Percentage Column Chart](#Stacked Percentage Column Chart)
  • [Horizontal Stacked Bar Chart](#Horizontal Stacked Bar Chart)
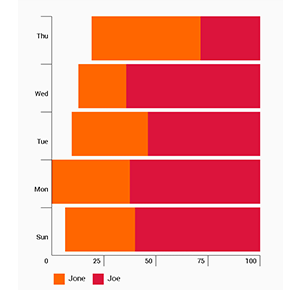
  • [Horizontal Stacked Percentage Bar Chart](#Horizontal Stacked Percentage Bar Chart)
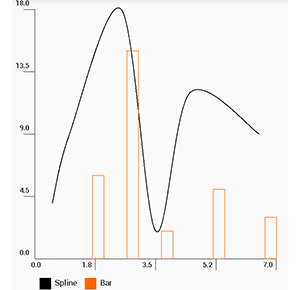
  • [Combined Spline and Bar Chart](#Combined Spline and Bar Chart)
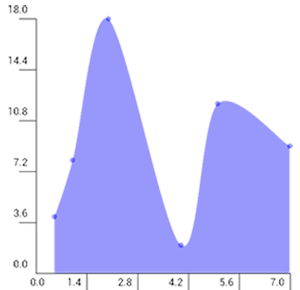
  • [Spline Area Chart](#Spline Area Chart)
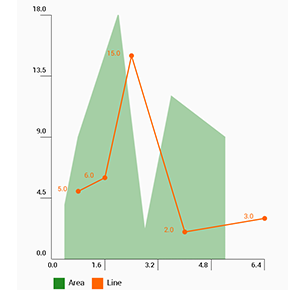
  • [Combined Line and Area Chart](#Combined Line and Area Chart)
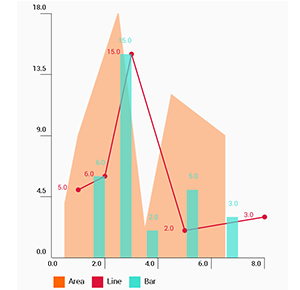
  • [Combined Column, Line and Area Chart](#Combined Column, Line and Area Chart)
  • [Stacked Area Chart](#Stacked Area Chart)
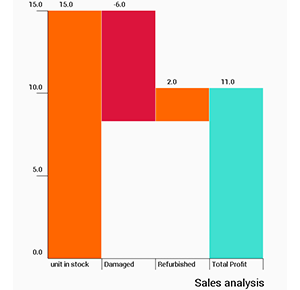
  • [Water Fall Chart](#Water Fall Chart)
  • [Line Chart with TrendLines](#Line Chart with TrendLines)
  • [Line Chart with Trendzone](#Line Chart with Trendzone)
  • [Bar Chart with TrendLines](#Bar Chart with TrendLines)
  • [Bar Chart with Trendzone](#Bar Chart with Trendzone)
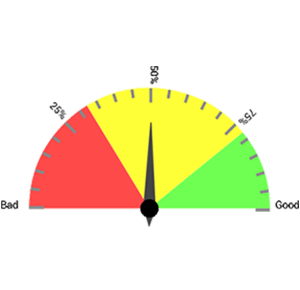
  • [Gauge Chart](#Gauge Chart)
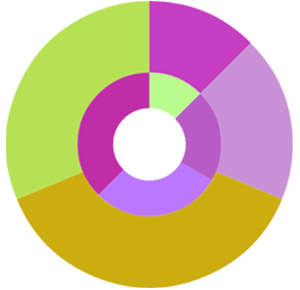
  • [Multi Level Pie Chart](#Multi Level Pie Chart)
  • [Step Line Chart](#Step Line Chart)
  • [Multi-Series Step Line Chart](#Multi-Series Step Line Chart)
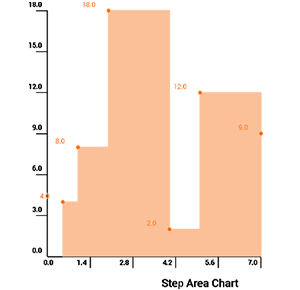
  • [Step Area Chart](#Step Area Chart)
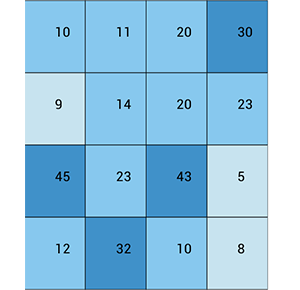
  • [Heat Map](#Heat Map)
  • [Bar Chart with Inverse Y-Axis](#Bar Chart with Inverse Y-Axis)
  • [Line Chart with Inverse Y-Axis](#Line Chart with Inverse Y-Axis)
  • [Scatter Chart with Inverse Y-Axis](#Scatter Chart with Inverse Y-Axis)
  • [Logarithmic Line Chart](#Logarithmic Line Chart)
  • [Logarithmic Multi-Series Line Chart](#Logarithmic Multi-Series Line Chart)
  • [Logarithmic Bar Chart](#Logarithmic Bar Chart)
  • [Horizontal Range Stacked Bar Chart](#Horizontal Range Stacked Bar Chart)
  • [Percentage Range Stacked Column Chart](#Percentage Range Stacked Column Chart)
  • [Horizontal Percentage Range Bar Chart](#Horizontal Percentage Range Bar Chart)

Tutorials:

Chart types:

  • Line Chart (simple design)

alt tag

  • Bar Chart (simple design)

alt tag

  • Scatter Chart (simple design)

alt tag

  • Bubble Chart

alt tag

  • Pie Chart (Simple)

alt tag

  • Donut Chart (Simple)

alt tag

  • Radar Chart (Simple)

alt tag

  • Candle Stick Chart

alt tag

  • Grouped Bar Chart

alt tag

  • Multi-Series Bubble Chart

alt tag

  • Multi-Series Line Chart

alt tag

  • Area Chart

alt tag

  • Multi-Series Scatter Chart

alt tag

  • Combined Line and Bar Chart

alt tag

  • Semi Circle Pie Chart

alt tag

  • Multi-Series Spline Chart

alt tag

  • Spline Chart

alt tag

  • Horizontal Bar Chart

![alt tag](https://raw.github.com/numetriclabz/numAndroidCharts/master/screenshots/horizontal-bar chart.png)

  • Pyramid Chart

alt tag

  • Funnel Chart

alt tag

  • Stacked Bar Chart

alt tag

  • Column Range Chart

alt tag

  • Stacked Percentage Column Chart

alt tag

  • Horizontal Stacked Bar Chart

alt tag

  • Horizontal Stacked Percentage Bar Chart

alt tag

  • Combined Spline and Bar Chart

alt tag

  • Spline Area Chart

alt tag

  • Combined Line and Area Chart

alt tag

  • Combined Column, Line and Area Chart

alt tag

  • Stacked Area Chart

alt tag

  • Water Fall Chart

alt tag

  • Line Chart with TrendLines

alt tag

  • Line Chart with Trendzone

alt tag

  • Bar Chart with TrendLines

alt tag

  • Bar Chart with Trendzone

alt tag

  • Gauge Chart

alt tag

  • Multi Level Pie Chart

alt tag

  • Step Line Chart

alt tag

  • Multi-Series Step Line Chart

alt tag

  • Step Area Chart

alt tag

  • Heat Map

alt tag

  • Bar Chart with Inverse Y-Axis

alt tag

  • Line Chart with Inverse Y-Axis

alt tag

  • Scatter Chart with Inverse Y-Axis

alt tag

  • Logarithmic Line Chart

alt tag

  • Logarithmic Multi-Series Line Chart

alt tag

  • Logarithmic Bar Chart

alt tag

  • Horizontal Range Stacked Bar Chart

alt tag

  • Percentage Range Stacked Column Chart

alt tag

  • Horizontal Percentage Range Bar Chart

alt tag

Comments
  • Cannot create labels on Funnel chart

    Cannot create labels on Funnel chart

    Hi, thanks for the lib - great work!

    I am not able to see the labels for funnel chart:

    values.add(new ChartData("visits", 3000)); values.add(new ChartData("unique visits", 2000)); values.add(new ChartData("unique visitors", 1000)); values.add(new ChartData("unique session", 500)); values.add(new ChartData("log out", 400));

    I am using the above code to render it. Exactly like it is done in the tutorial. However as the other factors seem to work, the labels are not to be seen.

    bug 
    opened by Junaid-Sakib 6
  • Null pointer exception is called in HeatMap.java:45 when the view is included from xml file.

    Null pointer exception is called in HeatMap.java:45 when the view is included from xml file.

    The problem comes because the columns list is null initially and it is being called in the view. I think this issue could be solved by simply initialising rows, columns and data fields with 0 size arraylists.

    opened by layogm 2
  • Is it possible to create group bar chart in 2.2.4 version

    Is it possible to create group bar chart in 2.2.4 version

    I am Using compile 'com.github.PhilJay:MPAndroidChart:v2.2.4'

    ArrayList labels = new ArrayList(); ArrayList datasets = new ArrayList<>();

    when i try to create BarData data = new BarData(labels, datasets);

    Constructor cannot be resolved is showing. What is the possible solution for the same. In Old version 2.1.6 this issue not coming.

    opened by 26201 0
  • Labels in Funnel Chart

    Labels in Funnel Chart

    Hi, Thanks for good chart support, could you please tell me how to set the labels for each funnel item. I gone through you previous issues but still i am not getting it with you latest api.

    opened by akshaykumar0291 0
  • issue with multiple linechart in same fragment

    issue with multiple linechart in same fragment

    i want to implement 3 line chart in same fragment, first of all i want to implement in scrollview but it is not set only 3rd linechart is shown then i implement 3 button and when perticular button is click then line chart is drawn but this is also not implement all 3 line cart is shown with clubing, in this library one function is missing which recreate graph with new data. can you help me with that.

    opened by kashifansari786 0
  • Waterfall chart data ploating issue

    Waterfall chart data ploating issue

    Hi,

    I am using WaterFallChart class to plot a chart. When I passed 2 or more consecutive negative values in data It starts plotting red color bar from top edge of previous red bar. If I pass alternate values(positive and negative) it plots properly.

    Need your help to fix this issue. Thanking you.

    opened by gmcodebuster 0
  • How to show data labels with circle in Stacked Area Chart ??

    How to show data labels with circle in Stacked Area Chart ??

    Hello Friend,

    I have searched method over the AreaStackChart.java file, but didn't found it. I need to display the data labels, How can I do that ?

    Also is any way to scroll chart horizontally to set more data ?

    Thanks

    opened by jayesh28589 0
  • SemiCircle chart flips

    SemiCircle chart flips

    Hello, i have implemented SemiCircle chart in my project, i have a view pager in that a list of data when i come back to same page chart flips? what could be the issue? the issue mainly comes when while m on the activity and call comes or i navigate to some other via notifications or recent activities and then come back on the same activity, Semicircle chart flips

    opened by NayanaRBhoj 0
Owner
shashank jain
shashank jain
Android Charting Library

What is desCharts? yet another android charting library Why the name desCharts? a tribute to René Descartes, father of analytical geometry Where is th

Sid Bradipao 226 Nov 28, 2022
A powerful 🚀 Android chart view / graph view library, supporting line- bar- pie- radar- bubble- and candlestick charts as well as scaling, panning and animations.

⚡ A powerful & easy to use chart library for Android ⚡ Charts is the iOS version of this library Table of Contents Quick Start Gradle Maven Documentat

Philipp Jahoda 36k Dec 31, 2022
A powerful 🚀 Android range bar chart library as well as scaling, panning and animations.

RangeBarChart ⚡ Range bar chart library for Android using MPAndroidChart ⚡ There were no charts in MPAndroidChart to show ranges. We were forced to sh

Ted Park 8 Nov 24, 2022
✨ A very Minimal, Sleek and Powerful Graph library for Android using Jetpack Compose

Composable-Graphs ( Jetpack Compose ) ✨ A very Minimal, Sleek and Lightweight Graph library for Android using Jetpack Compose Gradle Setup allprojects

Jai Keerthick 18 Dec 29, 2022
AnyChart Android Chart is an amazing data visualization library for easily creating interactive charts in Android apps. It runs on API 19+ (Android 4.4) and features dozens of built-in chart types.

AnyChart for Android AnyChart Android Charts is an amazing data visualization library for easily creating interactive charts in Android apps. It runs

AnyChart 2k Jan 4, 2023
Android Library to rapidly develop attractive and insightful charts in android applications.

williamchart Williamchart is an Android Library to rapidly implement attractive and insightful charts in android applications. Note: WilliamChart v3 h

Diogo Bernardino 4.9k Dec 30, 2022
Android Tableau library supports variety of graphs which developers simply integrate visualization reports on Android application.

Android Tableau Library Android Tableau library supports variety of graphs which developers simply integrate visualization reports on Android applicat

Sung Hyun 54 Jan 1, 2023
Android Library to rapidly develop attractive and insightful charts in android applications.

williamchart Williamchart is an Android Library to rapidly implement attractive and insightful charts in android applications. Note: WilliamChart v3 h

Diogo Bernardino 4.8k Dec 22, 2021
An Android chart and graph library

EazeGraph EazeGraph is an Android library for creating beautiful and fancy charts. Its main goal was to create a lighweight library which is easy to u

Paul Cech 1.6k Dec 23, 2022
Charts/graphs library for Android compatible with API 8+, several chart types with support for scaling, scrolling and animations

HelloCharts for Android Charting library for Android compatible with API 8+(Android 2.2). Works best when hardware acceleration is available, so API 1

Leszek Wach 7.4k Jan 6, 2023
Android Graph Library for creating zoomable and scrollable line and bar graphs.

Chart and Graph Library for Android Project maintainer wanted! For time reasons I can not continue to maintain GraphView. Contact me if you are intere

Jonas Gehring 2.7k Jan 5, 2023
Android Graph Library for creating zoomable and scrollable line and bar graphs.

Chart and Graph Library for Android Project maintainer wanted! For time reasons I can not continue to maintain GraphView. Contact me if you are intere

Jonas Gehring 2.7k Jan 2, 2023
An easy-to-use Android charts library with animation.

AndroidCharts A simple Android charts library. Known Uses in Pomotodo Including in Your Project Eclipse Import /AndroidCharts folder. Move /java folde

HackPlan 1.3k Jan 2, 2023
YBKChart is a library of 3D graphics charts for Android. 📊

YBKChart is a library of 3D graphics charts for Android. ?? For more information, see the Wiki. Chart List Pie Chart Download Use gradle. rep

ByungKwan Yun 10 Jun 19, 2022
Library for charts in android with animations

Charts Gradle Setup Step 1. Add the JitPack repository to your build file Add it in your root build.gradle at the end of repositories: allprojects {

Ayush Saini 4 Dec 30, 2022
Donut is an Android library which helps you to easily create beautiful doughnut-like charts.

Doughnut-like graph view capable of displaying multiple datasets with assignable colors

Futured 509 Jan 3, 2023
An android compose library with different Graphs and Charts

plot An android compose library with different Graphs and Charts (currently supports only Line graph, more types will be added soon) Download reposito

Madrapps 106 Dec 30, 2022
Android library for drawing Pie charts and Donut charts with the ability to customize almost anything in it.

A Pie/Donut*/Ring chart for Android, customizable to the most extent possible. For tutorial and examples refer to the website. build.gradle[.kts] impl

Mahdi Hosseinzadeh 20 Nov 18, 2022